So having nothing better to do, I wasted my morning messing around with the MOHW data. Here’s a few highlights.
Dividing deaths into ‘healthy’ (no comorbidities) and ‘unhealthy’ (all the rest), it looks like this for healthy people:
| <30 | 30s | 40s | 50s | 60s | 70s | 80s | 90s | |
|---|---|---|---|---|---|---|---|---|
| All deaths | 13 | 3 | 18 | 20 | 55 | 70 | 102 | 78 |
| unvaxed | 11 | 3 | 10 | 11 | 30 | 48 | 49 | 49 |
| vaxed | 2 | 0 | 8 | 9 | 25 | 22 | 53 | 29 |
| 1 dose | 1 | 0 | 1 | 1 | 6 | 2 | 6 | 5 |
| 2 doses | 0 | 0 | 1 | 4 | 5 | 4 | 15 | 12 |
| 3 doses | 1 | 0 | 6 | 4 | 14 | 15 | 32 | 12 |
| 4 doses | 0 | 0 | 0 | 0 | 0 | 1 | 0 | 0 |
These are about 6.6% of all COVID deaths.
If we divide number of deaths by the total number of people in each agegroup we get a crude estimate of single-event risk for healthy people during a COVID (omicron) surge in Taiwan. This involves a rather suspect assumption that the entire population has no life-threatening illness (which is probably true for under 40s and increasingly less true for older people). However it’s the best we can do; and we can compare these numbers with 12-month all-cause mortality risk:
| <30 | 30s | 40s | 50s | 60s | 70s | 80s | 90s | |
|---|---|---|---|---|---|---|---|---|
| Pop (m) | 7.3 | 3.5 | 3.8 | 3.6 | 3.1 | 1.5 | 0.7 | 0.1 |
| covrisk/m | 2 | 1 | 5 | 6 | 18 | 47 | 146 | 780 |
| allrisk/m | 277 | 847 | 2283 | 5023 | 9858 | 24874 | 77863 | 183656 |
We can’t really pull the same trick with ‘people who died while unhealthy’ because unhealthy people represent a much smaller (unknown) fraction of the population; their risk of death is therefore considerably higher than it would appear. So, taking care to remember what this number represents (“risk of being recorded as a COVID death per million population”), here’s the same calculation for the entire dataset:
| <30 | 30s | 40s | 50s | 60s | 70s | 80s | 90s | |
|---|---|---|---|---|---|---|---|---|
| Cov/mil | 5 | 13 | 39 | 100 | 294 | 968 | 2893 | 12730 |
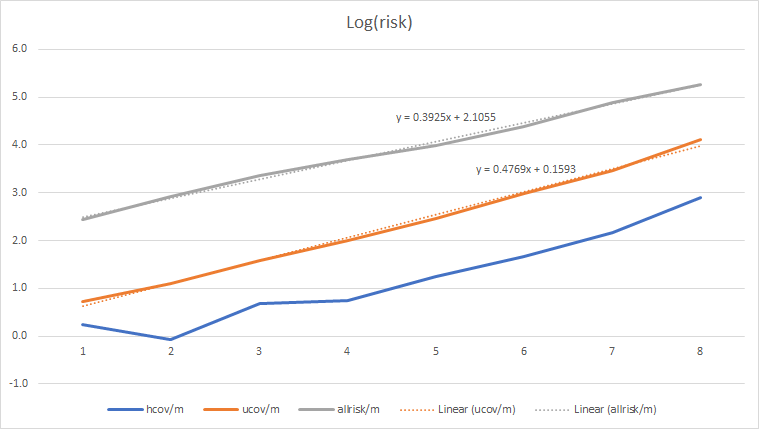
Taking log values is informative. Here ‘hcov’ and ‘ucov’ mean ‘healthy covid deaths’ and ‘unclassified covid deaths’ respectively. To be clear, these values are log(risk/million):
| <30 | 30s | 40s | 50s | 60s | 70s | 80s | 90s | |
|---|---|---|---|---|---|---|---|---|
| hcov | 0.3 | -0.1 | 0.7 | 0.7 | 1.2 | 1.7 | 2.2 | 2.9 |
| ucov | 0.7 | 1.1 | 1.6 | 2.0 | 2.5 | 3.0 | 3.5 | 4.1 |
| allrisk | 2.4 | 2.9 | 3.4 | 3.7 | 4.0 | 4.4 | 4.9 | 5.3 |
Note that:
- COVID risk for healthy people (and remember we’re talking about the risk of being recorded as a COVID death, which is not exactly the same as dying of COVID) is 2-3 orders of magnitude less than your all-cause risk. It is completely insignificant. Even if you have notable comorbidities, COVID represents only 2% of your all-cause risk until you’re well into old age - and even in your 90s, it’s only 7%. That’s not a 7% risk of dying, but a 7% risk that your death certificate (if you’re unfortunate enough to receive one) says “COVID” on it somewhere. 831,000 out of 834,000 80+ oldies completely failed to die ‘of or with COVID’. 52,000 of them die in a normal year.
-
The COVID line has a slightly different slope to all-cause mortality, suggesting (but not confirming) that COVID was a partial factor in the CECC death list; but the fact that it’s an almost perfect straight line suggests that age and age-related disease was the primary factor.
-
The ‘healthy’ line is decidedly nonlinear, suggesting some complex combination of factors in these cases.
It’s interesting to compare these numbers with, say, the UK, which publishes data collected in a similar manner. The main difference is that that UK has a different collection of chronic diseases in the general population, and the vaccination rate is ‘inverted’ relative to Taiwan (which has about 100% coverage in under 40s, falling to <80% in the 80+ group). These numbers are from Q4 2021, which would have been equivalent in character (I imagine) to Taiwan’s current omicron wave:
| <30 | 30s | 40s | 50s | 60s | 70s | 80s | 90s | |
|---|---|---|---|---|---|---|---|---|
| Ukcovid | 77 | 201 | 505 | 1218 | 2235 | 3720 | 4435 | 2202 |
| Ukpop | 23.55 | 8.80 | 8.50 | 8.97 | 7.07 | 5.49 | 2.70 | 0.58 |
| Ukrisk | 3 | 23 | 59 | 136 | 316 | 678 | 1644 | 3771 |
| Twrisk | 5 | 13 | 39 | 100 | 294 | 968 | 2893 | 12730 |
The apparent risk is almost identical until you get to 70+; Taiwan then diverges dramatically. There are a whole bunch of possible interpretations; it may be, for example, that Taiwan is factoring in a lot more ‘ordinary’ deaths from old age than the UK did, or that Taiwan is relatively worse at treating COVID in the elderly, or that vaccination has a dramatic positive effect in older age groups (and no effect at all in younger ones). Again, though, relative to all-cause mortality, these numbers fade into the background noise.
TL;DR: if you’re under 70 and in good health, the chance of you making it onto the CECC’s justification-for-existence list is very, very small indeed; or from a different viewpoint, if you have a scheduled appointment with the grim reaper, you are overwhelmingly more likely to die of something other than COVID. Corollary: if you don’t want to die of-or-with the lurgy (or indeed of-or-with anything else), be healthy.