Ubereats can’t deliver to my door they deliver to the lobby. Can I leave my apartment to collect it at the lobby?
iirc no.
I usually make a message to the driver when on the way to come upstairs because I am in quarantine.
1 Like
I feel like they going to butcher that haha but I will try
Do you want a template for instructions?
I usually say something like 哈囉, 不好意思, 我現在在房子隔離中, 請您上樓把食物放下來. 謝謝
1 Like
Today, only 8 actual “Covid deaths” occurred in people without any chronic diseases. As usual, they were the elderly.
In any other time, these 8 deaths wouldn’t make front page news, nor require a daily press conference to make such an announcement.
Meanwhile, there’s been 1040 flu or pnu deaths in Taiwan in the past week alone.
Also in Taiwan in the past week, cancer killed around 140 each day.
Then, we have suicides among 15-25 year-olds. How many in the past week? Around 200 if we look at Taiwan’s 2020 data (the latest I could find). 10,659 suicides for that age group in that year.
Yet, apparently Covid is the only disease, illness or health issue that warrants overwhelming publicity, attention, expenditure, and daily govt press conferences to let everyone know these daily “Covid death tallies.” ![]()
Jabbing every single baby, child and adult - multiple times - can’t hide the fact that there are simply more important health issues in Taiwan far more deserving of our attention, than Covid. Especially when the IFRs for kids are infinitesimal - 0.0054% (age 1) to 0.0085% (age 17).
15 Likes
Jesus. Speak about hypochondria!
So how is Taiwan doing relative to our peers—HK, New Zealand, and Australia, places like us that didn’t really experience earlier waves, but have at different times contended with omicron in the community?
This guy on twitter has updated his charts, showing that in terms of cases we are following NZ pretty closely, and in terms of deaths we are trending higher than Australia and NZ yet thankfully still trending lower than HK which—as we all know—did extremely poorly in this regard.

Source: https://twitter.com/cptwei/status/1538907809785384960?cxt=HHwWgMCohfyfptsqAAAA
Guy
1 Like
Excellent points all around.
1 Like
Meanwhile, there’s been 1040 flu or pnu deaths in Taiwan in the past week alone.
If I am reading it correctly, the number of deaths due to flu/pneumonia appears to have more than doubled in the past six weeks. [top chart, red line]
As @FairComment pointed out, if they were plotted on the same graph as all the other things that kill people, with a linear scale, those would all be flat lines hugging Y=0.
3 Likes
Eh not hypochondria. Just a listing of the steps to follow if you want your employer to pay you sick leave.
Or at least get a box of instant noodles from the Government.
I did all that crap and never got an instant noodles box. I feel left out.
So having nothing better to do, I wasted my morning messing around with the MOHW data. Here’s a few highlights.
Dividing deaths into ‘healthy’ (no comorbidities) and ‘unhealthy’ (all the rest), it looks like this for healthy people:
| <30 | 30s | 40s | 50s | 60s | 70s | 80s | 90s | |
|---|---|---|---|---|---|---|---|---|
| All deaths | 13 | 3 | 18 | 20 | 55 | 70 | 102 | 78 |
| unvaxed | 11 | 3 | 10 | 11 | 30 | 48 | 49 | 49 |
| vaxed | 2 | 0 | 8 | 9 | 25 | 22 | 53 | 29 |
| 1 dose | 1 | 0 | 1 | 1 | 6 | 2 | 6 | 5 |
| 2 doses | 0 | 0 | 1 | 4 | 5 | 4 | 15 | 12 |
| 3 doses | 1 | 0 | 6 | 4 | 14 | 15 | 32 | 12 |
| 4 doses | 0 | 0 | 0 | 0 | 0 | 1 | 0 | 0 |
These are about 6.6% of all COVID deaths.
If we divide number of deaths by the total number of people in each agegroup we get a crude estimate of single-event risk for healthy people during a COVID (omicron) surge in Taiwan. This involves a rather suspect assumption that the entire population has no life-threatening illness (which is probably true for under 40s and increasingly less true for older people). However it’s the best we can do; and we can compare these numbers with 12-month all-cause mortality risk:
| <30 | 30s | 40s | 50s | 60s | 70s | 80s | 90s | |
|---|---|---|---|---|---|---|---|---|
| Pop (m) | 7.3 | 3.5 | 3.8 | 3.6 | 3.1 | 1.5 | 0.7 | 0.1 |
| covrisk/m | 2 | 1 | 5 | 6 | 18 | 47 | 146 | 780 |
| allrisk/m | 277 | 847 | 2283 | 5023 | 9858 | 24874 | 77863 | 183656 |
We can’t really pull the same trick with ‘people who died while unhealthy’ because unhealthy people represent a much smaller (unknown) fraction of the population; their risk of death is therefore considerably higher than it would appear. So, taking care to remember what this number represents (“risk of being recorded as a COVID death per million population”), here’s the same calculation for the entire dataset:
| <30 | 30s | 40s | 50s | 60s | 70s | 80s | 90s | |
|---|---|---|---|---|---|---|---|---|
| Cov/mil | 5 | 13 | 39 | 100 | 294 | 968 | 2893 | 12730 |
Taking log values is informative. Here ‘hcov’ and ‘ucov’ mean ‘healthy covid deaths’ and ‘unclassified covid deaths’ respectively. To be clear, these values are log(risk/million):
| <30 | 30s | 40s | 50s | 60s | 70s | 80s | 90s | |
|---|---|---|---|---|---|---|---|---|
| hcov | 0.3 | -0.1 | 0.7 | 0.7 | 1.2 | 1.7 | 2.2 | 2.9 |
| ucov | 0.7 | 1.1 | 1.6 | 2.0 | 2.5 | 3.0 | 3.5 | 4.1 |
| allrisk | 2.4 | 2.9 | 3.4 | 3.7 | 4.0 | 4.4 | 4.9 | 5.3 |
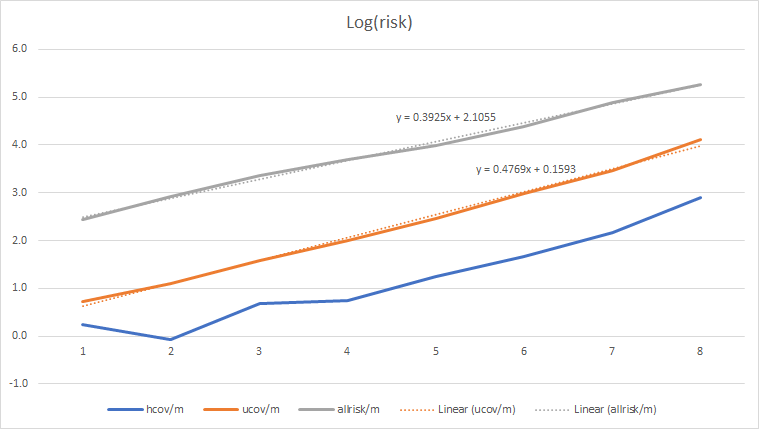
Note that:
- COVID risk for healthy people (and remember we’re talking about the risk of being recorded as a COVID death, which is not exactly the same as dying of COVID) is 2-3 orders of magnitude less than your all-cause risk. It is completely insignificant. Even if you have notable comorbidities, COVID represents only 2% of your all-cause risk until you’re well into old age - and even in your 90s, it’s only 7%. That’s not a 7% risk of dying, but a 7% risk that your death certificate (if you’re unfortunate enough to receive one) says “COVID” on it somewhere. 831,000 out of 834,000 80+ oldies completely failed to die ‘of or with COVID’. 52,000 of them die in a normal year.
-
The COVID line has a slightly different slope to all-cause mortality, suggesting (but not confirming) that COVID was a partial factor in the CECC death list; but the fact that it’s an almost perfect straight line suggests that age and age-related disease was the primary factor.
-
The ‘healthy’ line is decidedly nonlinear, suggesting some complex combination of factors in these cases.
It’s interesting to compare these numbers with, say, the UK, which publishes data collected in a similar manner. The main difference is that that UK has a different collection of chronic diseases in the general population, and the vaccination rate is ‘inverted’ relative to Taiwan (which has about 100% coverage in under 40s, falling to <80% in the 80+ group). These numbers are from Q4 2021, which would have been equivalent in character (I imagine) to Taiwan’s current omicron wave:
| <30 | 30s | 40s | 50s | 60s | 70s | 80s | 90s | |
|---|---|---|---|---|---|---|---|---|
| Ukcovid | 77 | 201 | 505 | 1218 | 2235 | 3720 | 4435 | 2202 |
| Ukpop | 23.55 | 8.80 | 8.50 | 8.97 | 7.07 | 5.49 | 2.70 | 0.58 |
| Ukrisk | 3 | 23 | 59 | 136 | 316 | 678 | 1644 | 3771 |
| Twrisk | 5 | 13 | 39 | 100 | 294 | 968 | 2893 | 12730 |
The apparent risk is almost identical until you get to 70+; Taiwan then diverges dramatically. There are a whole bunch of possible interpretations; it may be, for example, that Taiwan is factoring in a lot more ‘ordinary’ deaths from old age than the UK did, or that Taiwan is relatively worse at treating COVID in the elderly, or that vaccination has a dramatic positive effect in older age groups (and no effect at all in younger ones). Again, though, relative to all-cause mortality, these numbers fade into the background noise.
TL;DR: if you’re under 70 and in good health, the chance of you making it onto the CECC’s justification-for-existence list is very, very small indeed; or from a different viewpoint, if you have a scheduled appointment with the grim reaper, you are overwhelmingly more likely to die of something other than COVID. Corollary: if you don’t want to die of-or-with the lurgy (or indeed of-or-with anything else), be healthy.
6 Likes
With delta the “vaccination” gave you about an 20 years advantage over unvaxxed people against dying of covid. For healthy under 50s this did not outweigh the risk of getting vaccinated in first place. It’s a bit hard for UK numbers because many already have acquired natural immunity which is simply better than getting vaccinated.
So yes with delta the vaccination for old/fat people really made sense - with omicron it’s a bit hard to tell. It could be that it still makes some sense - or it could be that natural immunity from pre omicron simply helps other countries over Taiwan…
Yes, there’s a definite signal in favour of the vaccines here for a very specific subset of the population … even with omicron. But in the context of their all-cause risk - which is higher than the average as a result of their comorbidities - it’s not entirely obvious if it’s an important signal. To ascertain that, we’d need to know what fraction of the vaccinated and unvaccinated populations have comorbidities - and that information just isn’t available.
I deliberately made no comment here about the relative costs and risks of getting vaccinated there because it would have just made that post incomprehensible.
@FairComment: my estimate of expected age-at-death is 78 for this dataset. For vaccinated people with no comorbidities, it’s also 78. For unvaccinated people with no comorbidities, it’s 75. This is of course subject to considerable uncertainty because of the age quantization and the very small numbers we’re working with. For someone to die of cancer (or any of the other serious diseases on the list) at an average of 3 years prior to their expected lifespan strikes me as no great tragedy.
1 Like
It would be interesting to note the outcomes once you factor in VAERS data. As of today, the number of deaths in the 65 and over age group is 1007. The rest of the Taiwan age group data is located here.
Yeah, I didn’t even attempt to go there because of the inevitable slew of denial that would follow, but even if you were to accept that the vaccines don’t hurt anybody (despite overwhelming evidence - the US VAERS death count is apparently up to 28,000, or about 100 per million) vaccines still cost “lives” in terms of the money spent on them. You can view this in (at least) two ways:
-
The insurance value of a life-year in the West is US$50-100k, and since Taiwan must have spent at least US$2B vaccinating 20 million people, there should have been some payback to the tune of 30,000 life-years. As a crude estimate - from the observation that 75% of deaths were over 70 - we might generously say that each death represents 10 lost life years (it almost certainly wasn’t, since 95% appear to have been in end-of-life care, but let’s say it’s 10 years). Did the vax programme save 3000 (elderly) lives? Maybe. Maybe not. I don’t think anybody can even say for sure, because the data you need to make an estimate isn’t there. But that brings us to the second way of assessing effectiveness.
-
Could we have spent US$2B and saved 30,000 life-years in some other way? In other words, what was the missed opportunity cost? Might we have saved the lives of (say) 600 thirtysomethings with $2B ($3.3m per life)? Again, I don’t know. But I suspect we could have done. And I think most people in their 80s would agree that their own lives are not as important as those of their children and grandchildren.
1 Like
Dang. A 26-sigma event. That’s like a super-nova black swan event.
Anyway… maybe those who had been trying to have a baby and couldn’t during COVID-19, but had been vaccinated, can try a bit harder now that the vaccines wear off, supposedly.

To see what could cause the extreme drop in births, go back 9 months from May 2022, so to September 2021.
Taiwan was a poster child for successful vaccination. 91% of all Taiwanese residents received a vaccine dose. By October 1, 2021, 56% of ALL people of Taiwan received Covid vaccines.
Covid vaccines are known to “disrupt the menstrual cycle” and lower sperm counts. It is possible that some women, for a period of several months, could not conceive and become pregnant due to these disruptions. Because all Taiwanese women were vaccinated at almost the same time, those disruptions created a precipitous drop in birth rates.
2 Likes
![]()
Crikey.
I think I’d want to see data to the end of the year, monthly, before drawing any conclusions about vaccination - there could be other explanations - but it sure doesn’t look good. Taiwan was unique in that we had a far, far higher proportion of reproductive-age people getting vaccinated - 100% as opposed to 40,50,60% in most other countries.
Even if it wasn’t the vaccines, it’s reasonable to infer that (if that’s real rather than a statistical glitch) that something to do with the COVID response was the cause.
Does anyone know if a positive Covid test is required at the time of death, for these deaths to be classified as an official “Covid death”?