2014 update
(Note: parts of Dragonbones’ original text have been directly incorporated into this addition while dead links have been removed or replaced and some figures corrected.
Ideally the new information should be edited into the original post.  )
)
All you need to know about typhoons:
Taiwan gets hit by 3-4 typhoons each year on average, usually between July and September, although its weather is affected by a few more passing nearby. Typhoons can bring violent winds, tearing pieces of roofs off, downing signs, and creating a lethal hazard with flying debris. Severe flooding in low-lying areas is also a hazard, as are landslides.
If you’re moving to Taiwan, be sure to find out whether an area is prone to flooding before moving into an apartment, and be sure to live on the 2rd floor or above (3rd is even better) and make full emergency preparations if you do settle down in such an area. In Taipei, for example, ask whether the area under consideration flooded during Nari typhoon in 2001. Don’t just ask the landlord, who may lie to you in order to rent the place out. Ask a number of neighbors before you sign the lease.
By June, be sure to have everything you need to ride the storms out comfortably – see preparedness section below. If you are living in a reinforced concrete structure with storm glass windows, you won’t need to evacuate like they do in the US, where structures are flimsier. But you will likely be stuck indoors for a day or two, and might be cut off from power, roads, etc. for a week or so in a worst case scenario.
During the June to Oct. season, you should make a habit of checking for typhoon warnings every 2-3 days at least, and don’t go on any 2-day hikes (or longer) without some means of checking on the weather while out there. Check at least one of the following sites:
Joint Typhoon Warning Center (JTWC): usno.navy.mil/JTWC - This is the official site of the US Navy
If you try to access this site and are told “the server does not exist”, your provider likely has a DNS problem, and you may want to access this information via one of the other sites that present the images and data of the JTWC, like Hurricane Zone, Tropical Cyclones (CIMSS), or Tropical Data Information Service (explained below). Alternatively, you could use a proxy server (a list of proxy servers is here: publicproxyservers.com/proxy … ntry1.html) to access the original site indirectly.
Weather Underground: wunderground.com/tropical/ - Click on storms to see more info.
Tropical Storm Risk: tropicalstormrisk.com - If there is an active storm in the West Pacific it will be indicated by a colored dot - click on that dot to open page; click on the dot again to get a detailed map, then click on the storm name.
Western Pacific Weather: westernpacificweather.com/da … -analysis/ - A satellite map with explanatory symbols overlaid
Central Weather Bureau of Taiwan: cwb.gov.tw/eng/ - use the link for “Typhoon News”
Japanese Meteorological Agency (in English): jma.go.jp/en/typh/ - A typhoon map of the western Pacific as well as track and forecast maps of individual typhoons
Philippine Atmospheric Geophysical and Astronomical Services Administration (PAGASA):
pagasa.dost.gov.ph/tropical-cyclone - track forecast maps and other detailed information about typhoons
Sites that make use of the JTWC information:
Hurricane Zone: hurricanezone.net/ - Best mirror for JTWC images; click on a storm name to get the JTWC info.
Tropical Cyclones (CIMSS): tropic.ssec.wisc.edu/ - Click on West Pacific storm links or the storm symbol on the map.
Tropical Data Information Service (NOOA): rammb.cira.colostate.edu/ramsdis … opical.asp - This site has looped videos: check out the MTSAT 4km VIS/IR2 Floater & MTSAT 4km IR4 Floater links there
And to compare the storm path forecast by various agencies, go to http://www.typhoon2000.ph/multi/log.php.
Here you can choose between “logs” (past information, covering the current and previous typhoons) and “tracks” (forecasts issued by various agencies)
When a typhoon is near or “on top of” Taiwan, almost-real-time information about the position of the eye and rainfall is available here:
Central Weather Bureau of Taiwan: cwb.gov.tw/eng/ - use the links for “Satellite” and “Radar”
This site compares the tracks from different agencies at a glance – very convenient:
typhoon2000.ph/multi/log.php
For wind fields go to forecast.mssl.ucl.ac.uk/shadow/ then on the right go to Wind Fields and the approx time to impact, or open the JTWC site if you can.
Also keep an eye on the actual typhoons thread on Forumosa.com (a new one every year, named “typhoons 20xx”), since we always give a shout when one has been spotted, and discuss forecast paths, severity and so on. It’s best to have a radio and batteries to power it in case of a power outage, which can sometimes last a week or more.
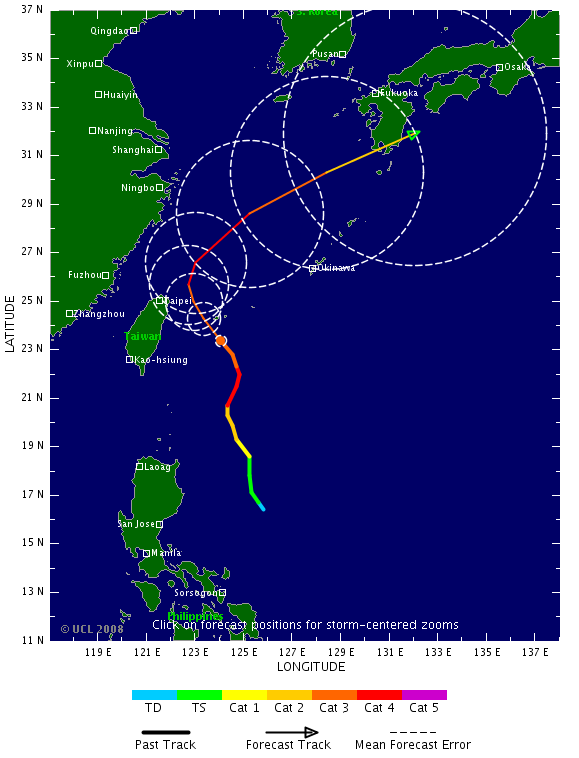
[color=blue]How to read the Joint Typhoon Warning Center forecasts[/color]
The typhoon center is shown with its past history as black circles, taken like snapshots every 6 hours; hollow circles show the storm’s weak beginnings; solid ones are stronger. Its forecast future position is shown in happy little pink dots, so the direction of its path is from black to pink. There are dates attached to the pink dots showing the present and future forecast positions. 2618Z, as in the present position in the above example, is the 26th, at 18:00 hours (that’s 6pm), and Z stands for Zulu time. To get from Zulu time (GMT) to Taipei time, have another beer and add 8 hours; the center dot at that position is therefore where the storm will be centered at 2am on the 27th, our time.
The typhoon itself is much bigger than the center of the happy little pink dot thingies. The size of the storm isn’t shown, but the outer pink circles with notches show the extent of the area where the wind speed is at least 35 knots (17.5m/s or 39mph or 63km/h), which is one way to show the storm’s size.
For a satellite image of the storm’s real size, you can see the storm clouds of the typhoon and their size and distance in relation to Taiwan by going to a different link on the JTWC site, entitled Multispectral Satellite Imagery or the Satellite Imagery links at the mirror sites.
Note that typhoons don’t start at the edge of some magic circle. You could get walloped by an outer feeder arm of the storm before the ‘storm’ hits; or you could be well within the ‘storm area’ and have blue sky. As a storm approaches, you can generally expect to have blustery weather with periodic, sudden downpours. [quote=“Dragonbones”]I’ve even gotten hit with fat raindrops from a blue, cloudless sky. Or maybe it was bird pee.[/quote]
Next, you want to look at the average wind speed of the storm (measured at the so called eye wall, in the center) and the top speed (gusts); the stronger the wind, the more powerful the storm is. This information is present on the maps in three ways. First, there’s a white box with dates, times and other figures next to the JTWC Warning Graphic map. Look in the first box for the lines saying the date/time, winds so many knots, gusts to so many knots. Knots are gnarly bits in wood, and the more of them there are, the stronger the wind. No, seriously, here’s a conversion chart from knots to meters per second, miles per hour, and kilometers per hour (rounded values):
Tropical Depression
winds <34 knots (kts)
x 0.514 = <17m/s
x 1.852 = <63km/h
x 1.152 = <39mph
Tropical Storm aka light typhoon
winds 34-64 knots
x 0.514 = 17-33m/s
x 1.852 = 63-119km/h
x 1.152 = 39-74mph
Typhoon, aka medium typhoon
winds 64-130 knots
x 0.514 = 33-67m/s
x 1.852 = 119-241km/h
x 1.152 = 74-150mph
Super Typhoon
winds over 130 knots
x 0.514 = >67m/s
x 1.852 = >241km/h
x 1.152 = >150mph
Easier rules of thumb (approximations) for in-your-head calculations:
For JTWC:
- value in knots divided by 2 is value in m/s
- value in knots times 1.8 = value in km/h
- value in knots times 1.15 = value in mph
For JMA and others:
- value in m/s times 3.6 = value in km/h
- value in m/s times 3.1 = value in mph
Not all such categorizations agree in terms of when a storm qualifies as a typhoon or super typhoon. This is just for rough reference; the key point is what ‘knots’ are inmph andkm/h. The CWB (Taiwan’s Central Weather Bureau) uses a different scale:
" qīng dù typhoon" (tropical storm; literally, ‘light degree’):
34-63 knots; Force 8 - Force 11
" zhōng dù typhoon" (typhoon; literally, ‘medium degree’):
64-99 knots; Force 12 - Force 15
" qiáng lìe typhoon" (super typhoon; lit. ‘strong degree’)
100 knots or greater; Force 16 or greater
The second and fastest way to check strength is to look at the circle at the center of the storm on the map. They use different centers for different storm strengths: Hollow circle centers represent the center of tropical depressions, not yet a storm. Hollow centers with protruding curved arms are the centers of tropical storms (in English) or light typhoons (in Chinese); when the center is solid, that’s a typhoon (in English) or medium typhoon (in Chinese). There’s no change in the graphic for a super typhoon – you have to look at the white wind speed box on the right to read that. (You might prefer the color coding at forecast.mssl.ucl.ac.uk/shadow/.)
Note that as a storm moves, it usually gets stronger, reaches a maximum forecast strength, and then (often around the time it hits Taiwan or Japan) rapidly weakens. So the type of center symbol used will vary along the path. The one that matters is for the time that the storm is forecast to be on top of YOU!
Third, there are concentric circles added around the typhoon center (for present and future dates only) to show “wind radii”, as the JTWC terms them. If there’s no added circle, the wind speed is weak (less than 34 knots (39mph; 63km/h). The stronger the storm is, the more circles are added. The outermost radii represents 34 knot winds; the second wind radii represents 50 knot winds; the next radii represents 64 knot winds. If that circle passes over you, it means you forgot to sacrifice the right animal to the gods. Stay indoors and preferably away from windows!
Now, what does all this mean for you?
The typhoon outside the biggest pink circle is just rain on and off, and a little wind. It’s ok to go to work, go on short hikes, etc. but bring a strong umbrella, and plan to be safe at home before the storm hits. On your way home, buy food, water, and other things recommended in this thread (Preparing for a Typhoon). Better yet, have all those things in advance!
The typhoon inside the biggest circle but outside the dark red one is stronger rain and wind, and pretty much when that hits where you live, it’s time to be indoors, well stocked with candybars and alcohol, and maybe some naughty videos. That’s a joke, Mom. JOKE. 
The typhoon inside the smaller bright red circle is a big bad wolf. Stay indoors and play naked twister with your roommates. Now, follow the magic line connecting the circles. Does that line go near your home on the map? If so, it’s going to be bad. Do not plan on flying. There have been numerous fatal air crashes in such weather. Oh, and if the magic line goes right on top of your home, you’re going to die.
No, just kidding. Follow the precautions, stay inside, and you’ll be fine. 
The size of the concentric circles shows the wind radii, which are not increasing along the forecast path. The hatched area which is shown to grow is not the typhoon’s size, but rather the possible areas the typhoon could deviate into. The further away in time, the more chance the storm has to deviate, and the wider the area, the less confident the prediction.