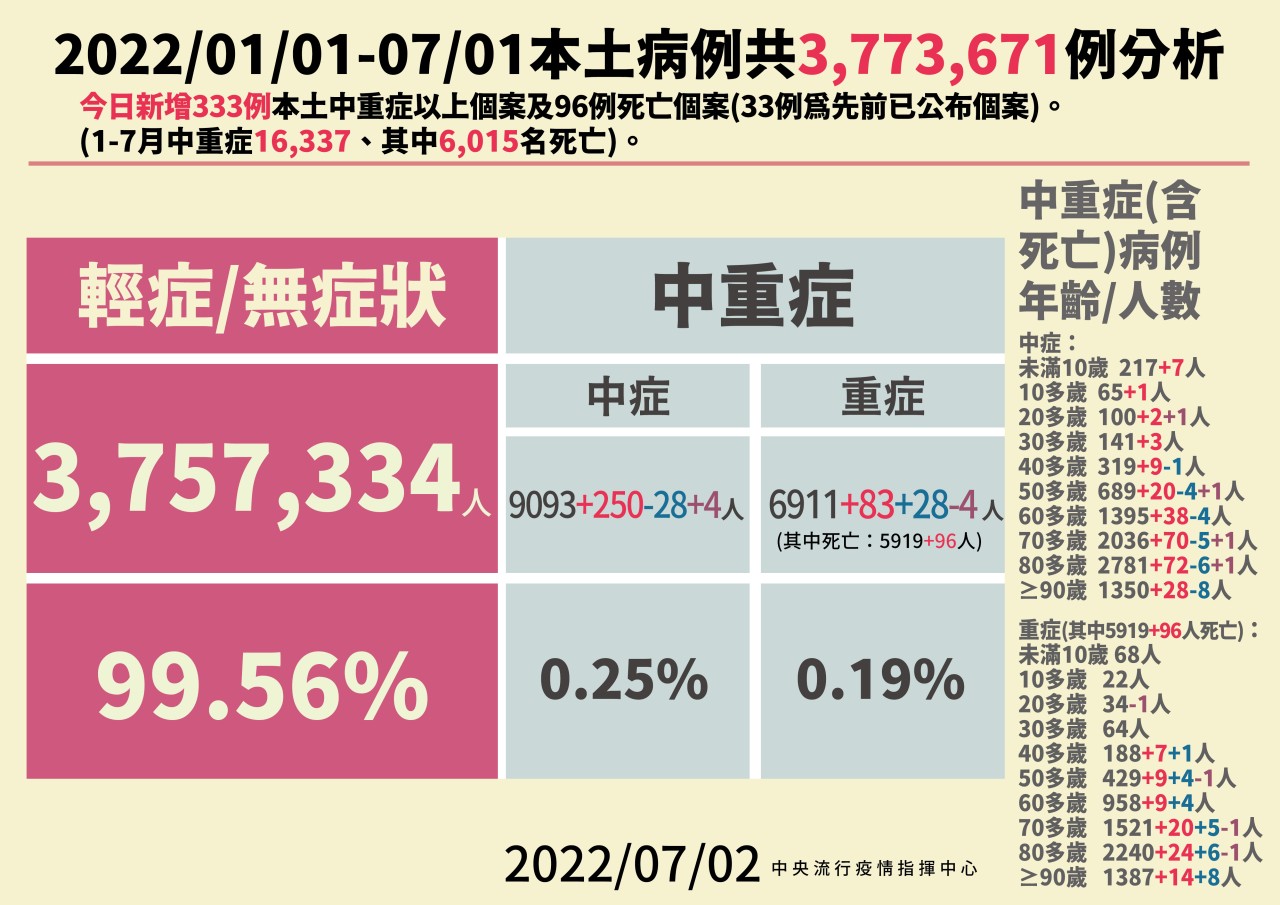
Summary
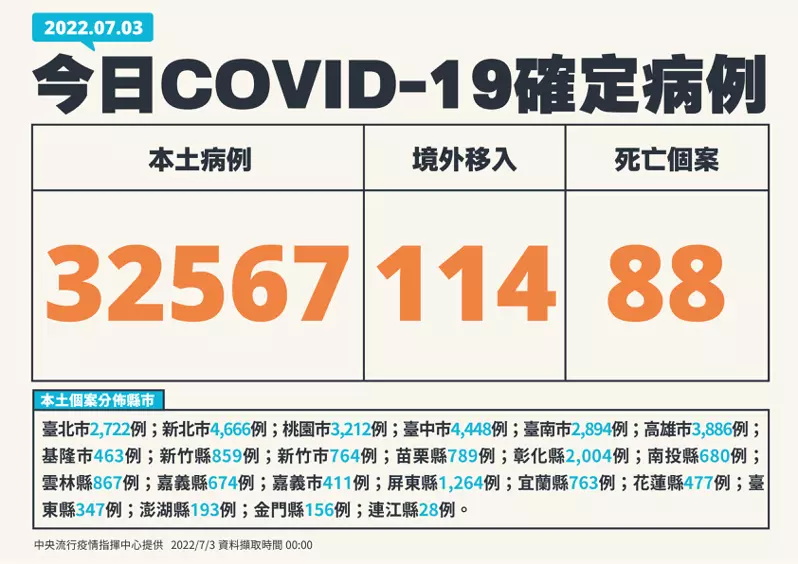
The Central Epidemic Command Center announced today (2) that there were 34,827 new confirmed cases of COVID-19 in Taiwan, including 34,748 local cases and 79 imported cases; 96 new deaths were confirmed among the confirmed cases.
The command center said that there were 34,748 new local cases today, including 16,319 males, 18,421 females, and 8 cases under investigation; the age ranged from under 5 years old to over 90 years old; the cases were distributed in Taichung City (4,952 cases), New Taipei City (4,738 cases), Kaohsiung City (4,397 cases), Taoyuan City (3,467 cases), Tainan City (3,001 cases), Taipei City (2,652 cases), Changhua County (2,234 cases), Pingtung County (1,377 cases), Yunlin County (1,036 cases), Miaoli County (889 cases), Hsinchu County (868 cases), Chiayi County (754 cases), Hsinchu City (735 cases), Nantou County (726 cases), Yilan County (672 cases), Hualien County (602 cases), Chiayi City (459 cases), Taitung County (445 cases), Keelung City (379 cases), Penghu County (183 cases), Kinmen County (158 cases), Lianjiang County (24 cases) .
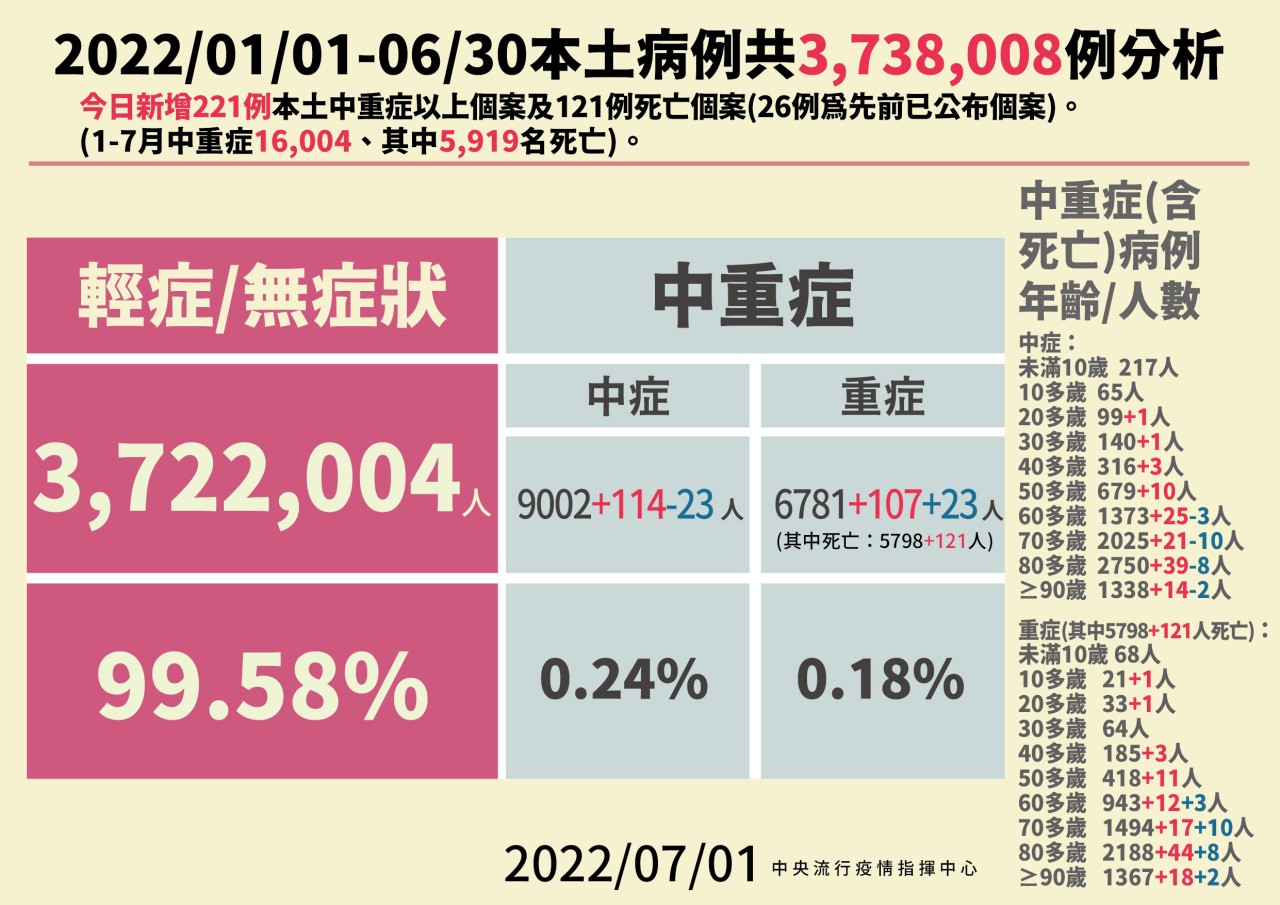
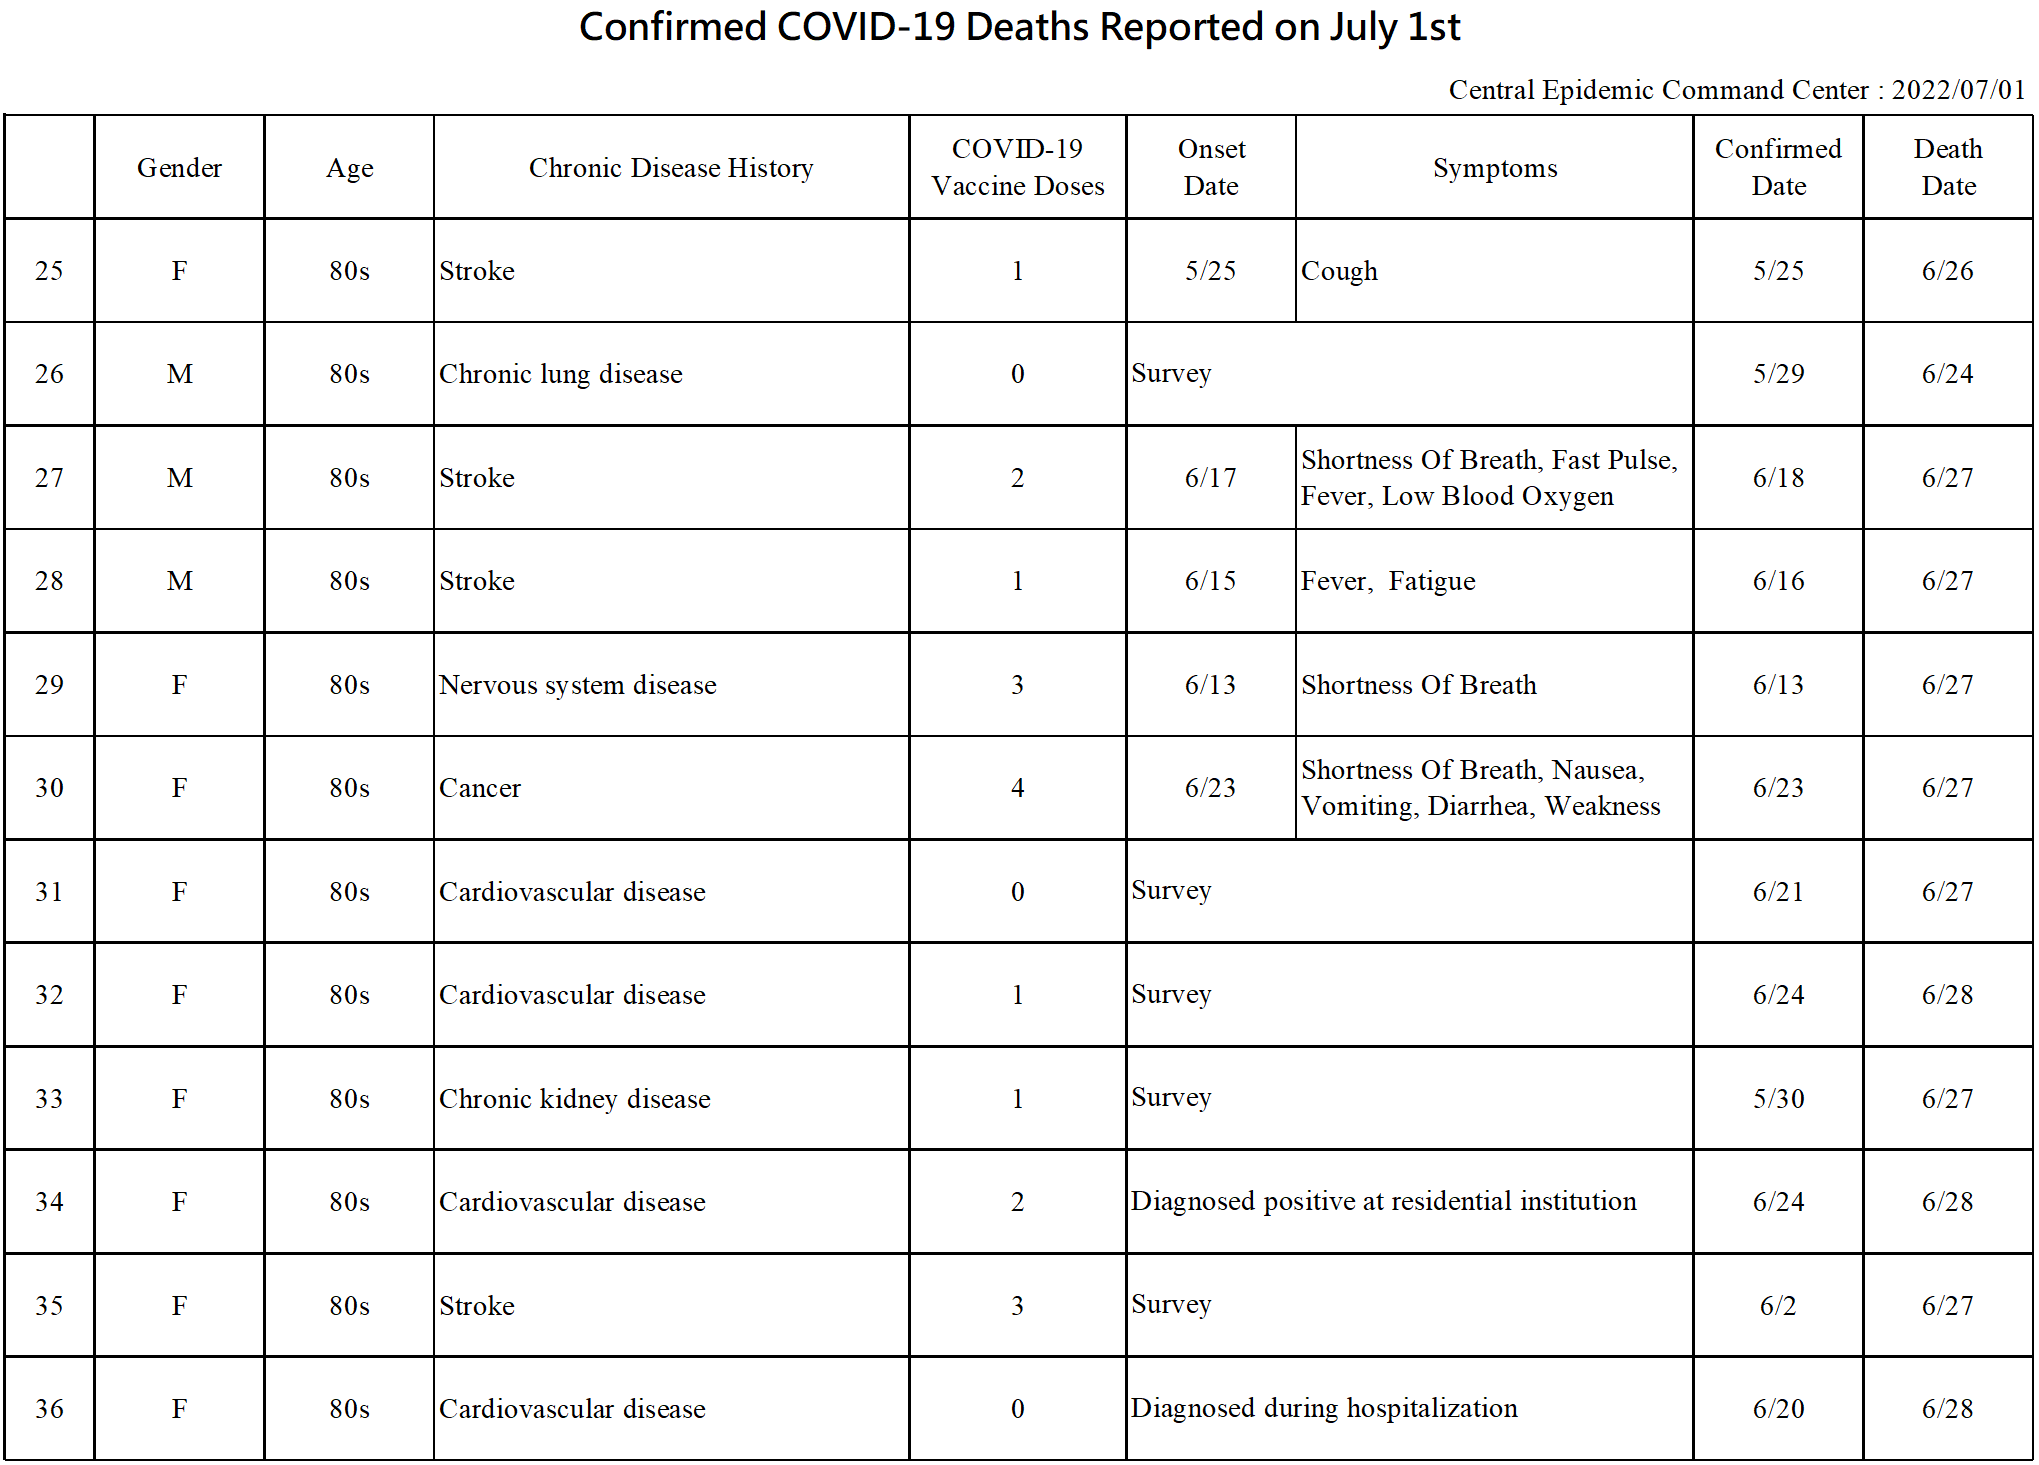
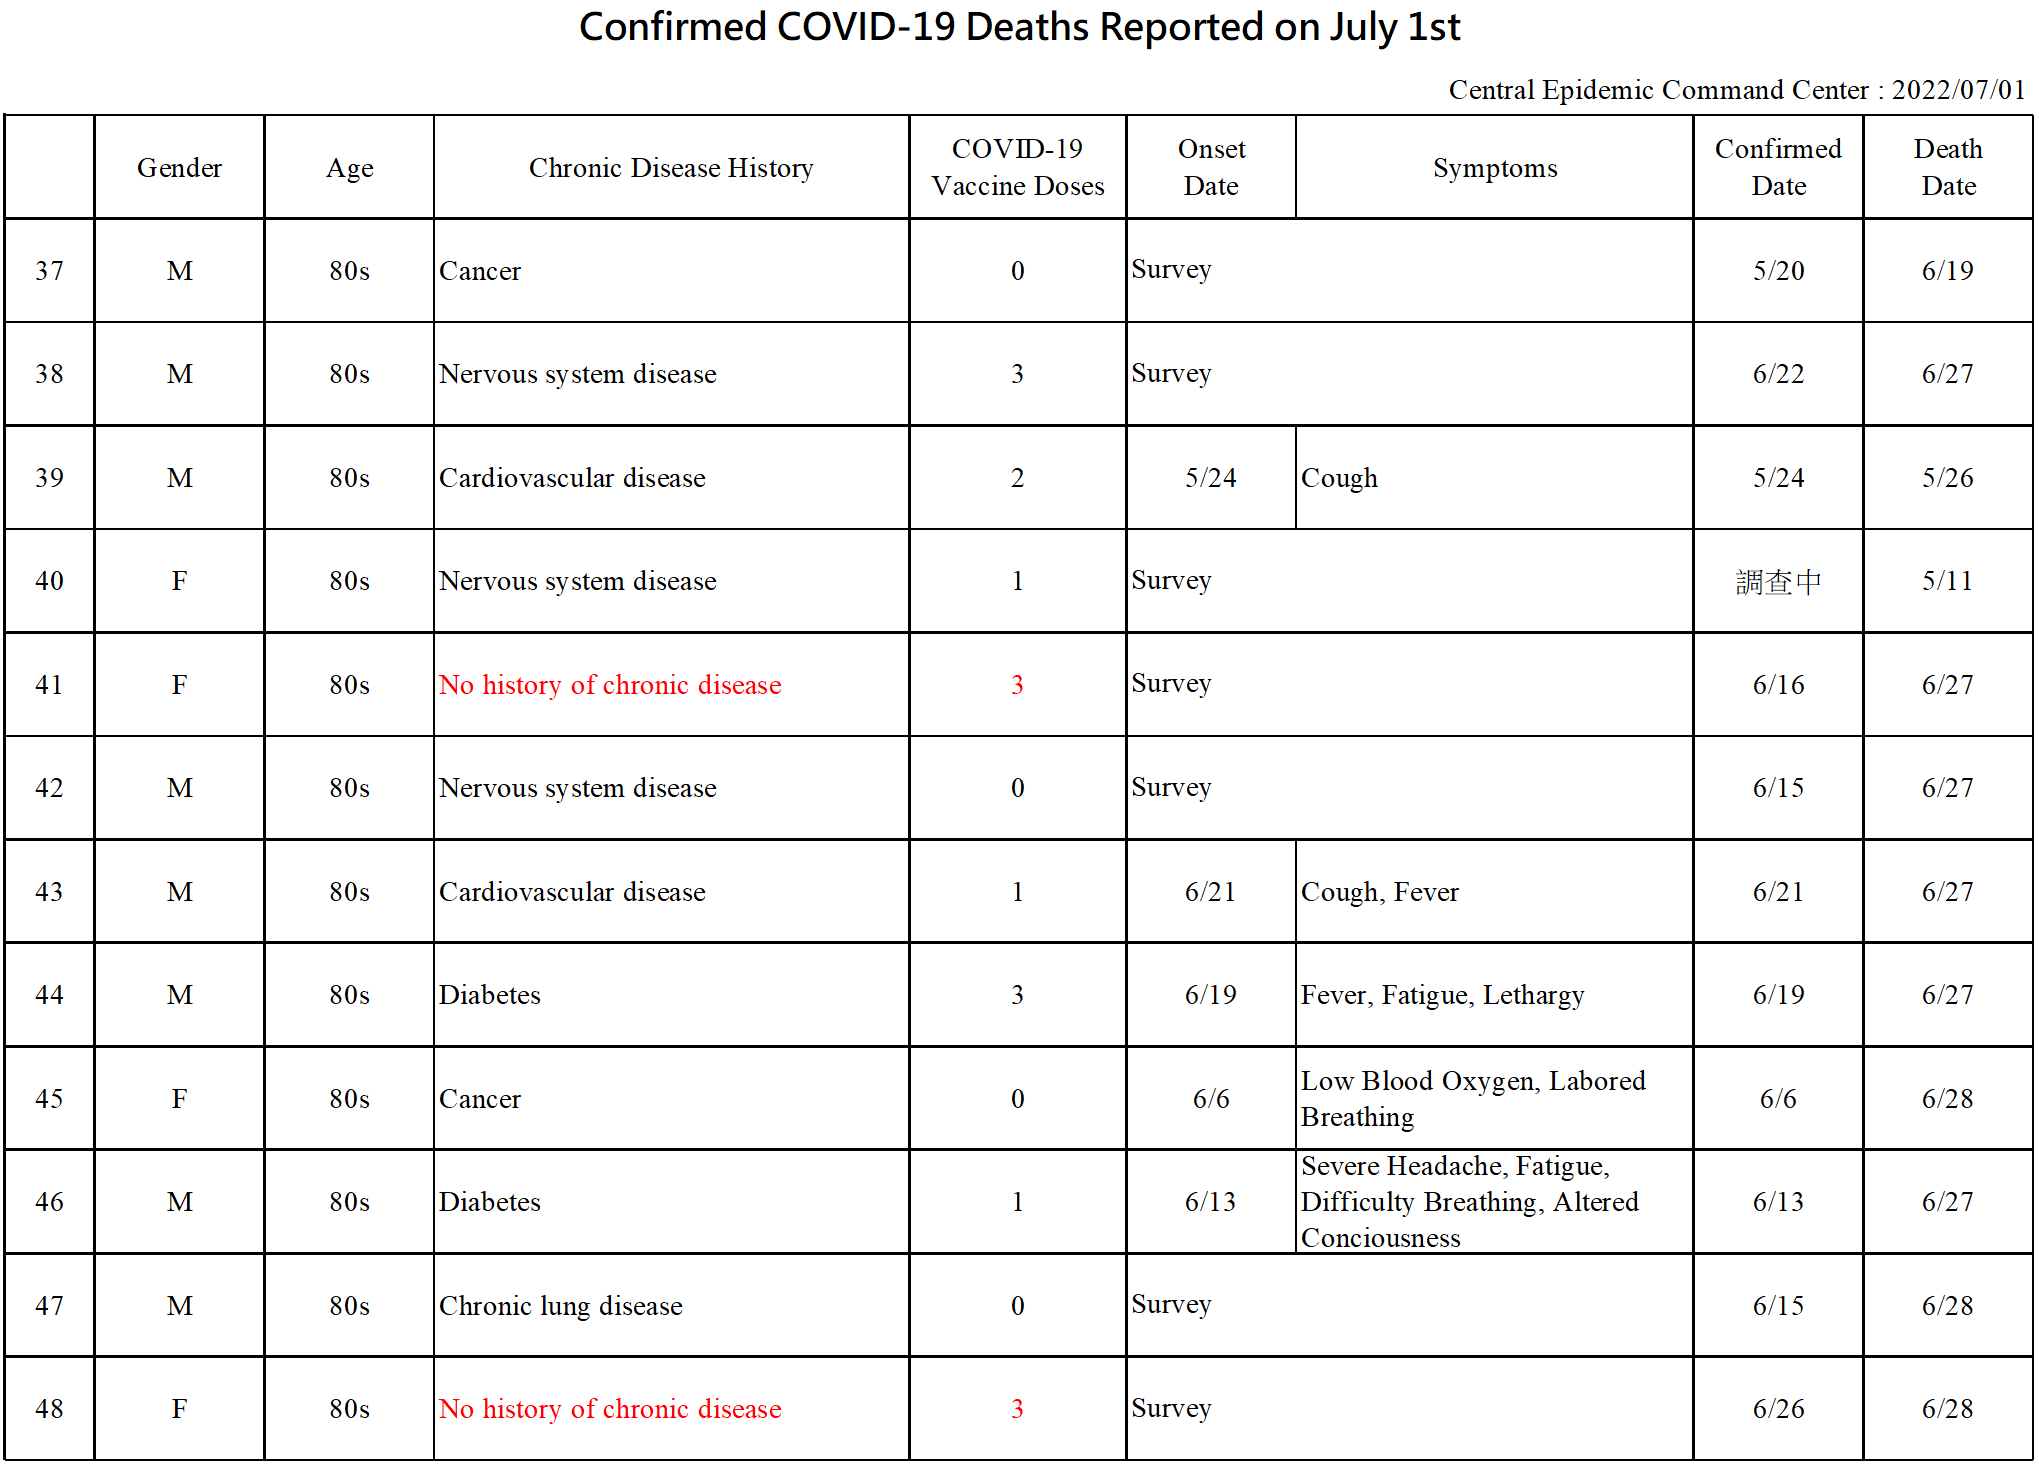
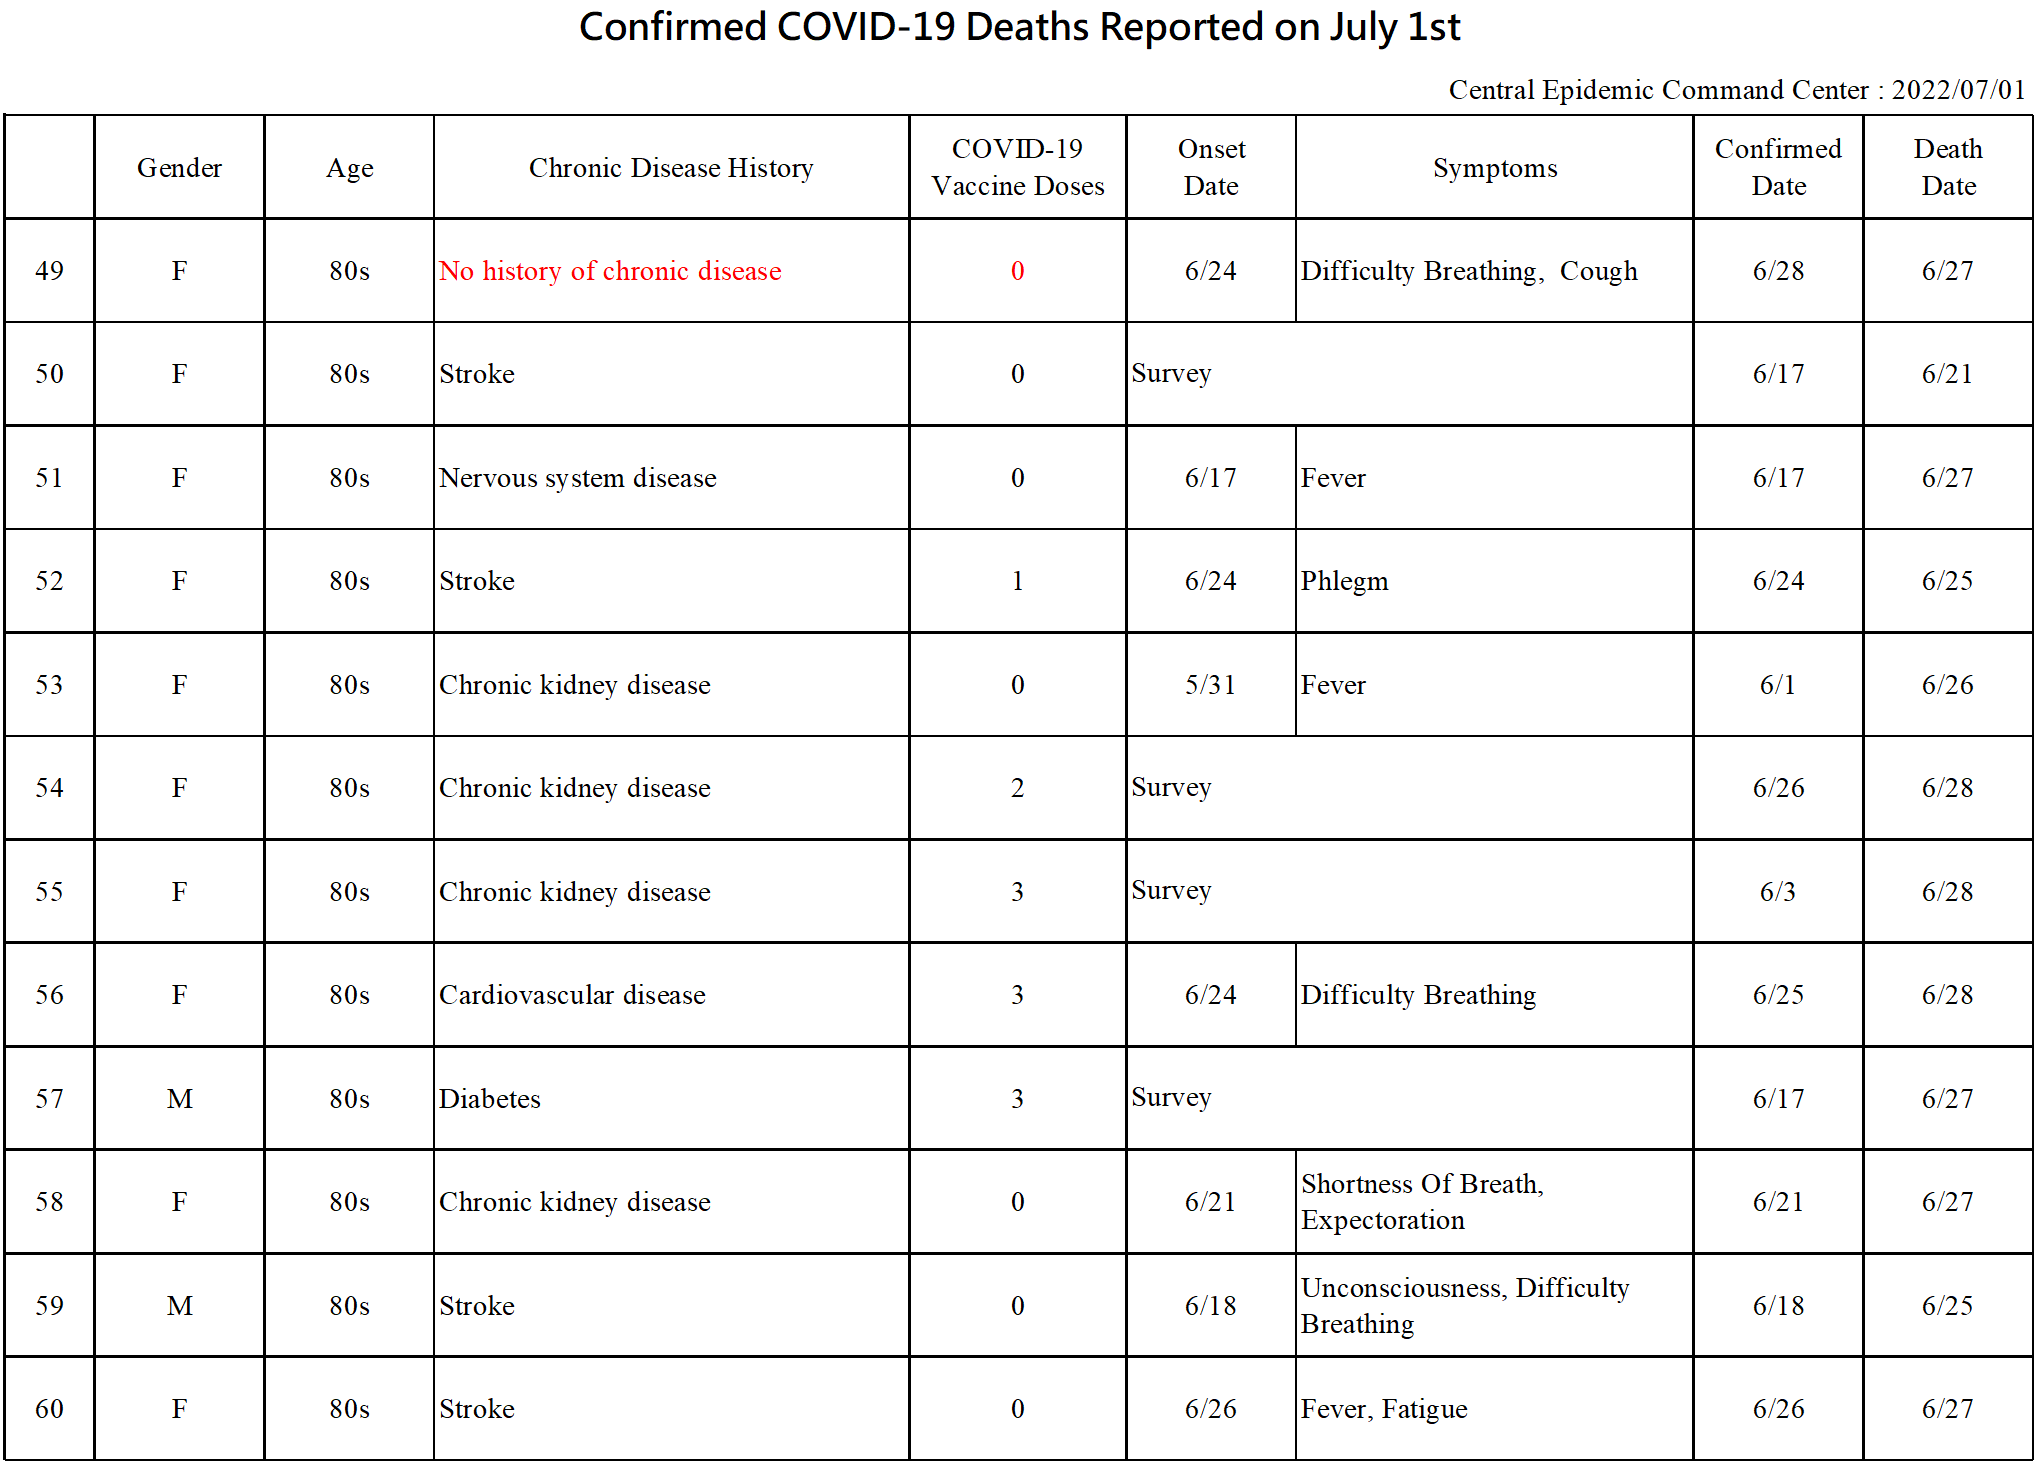
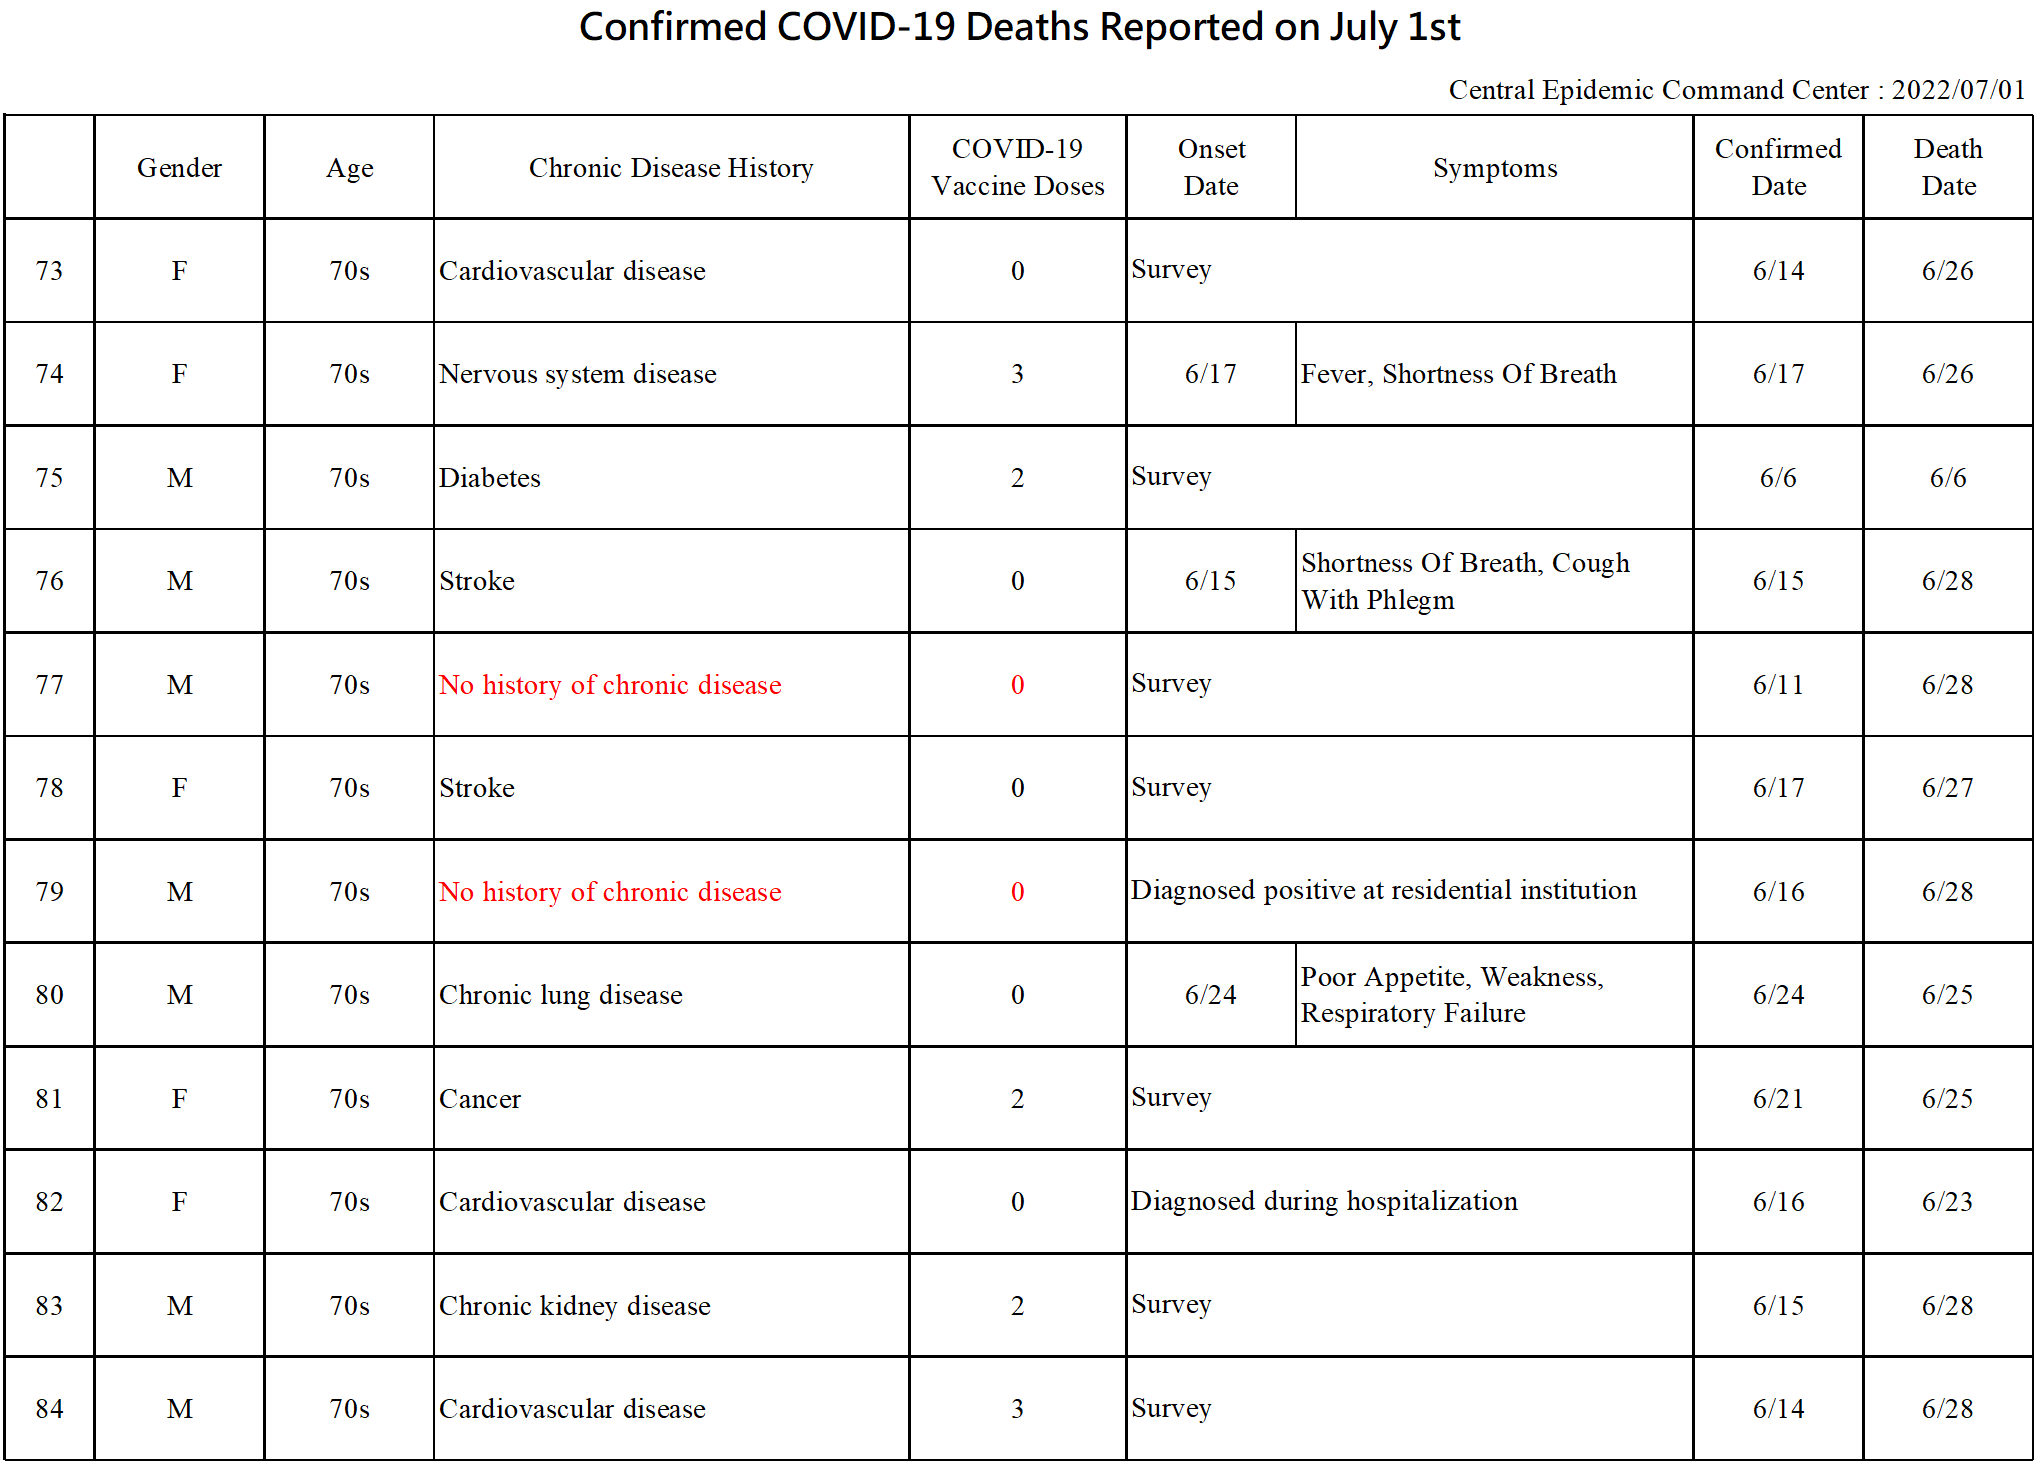
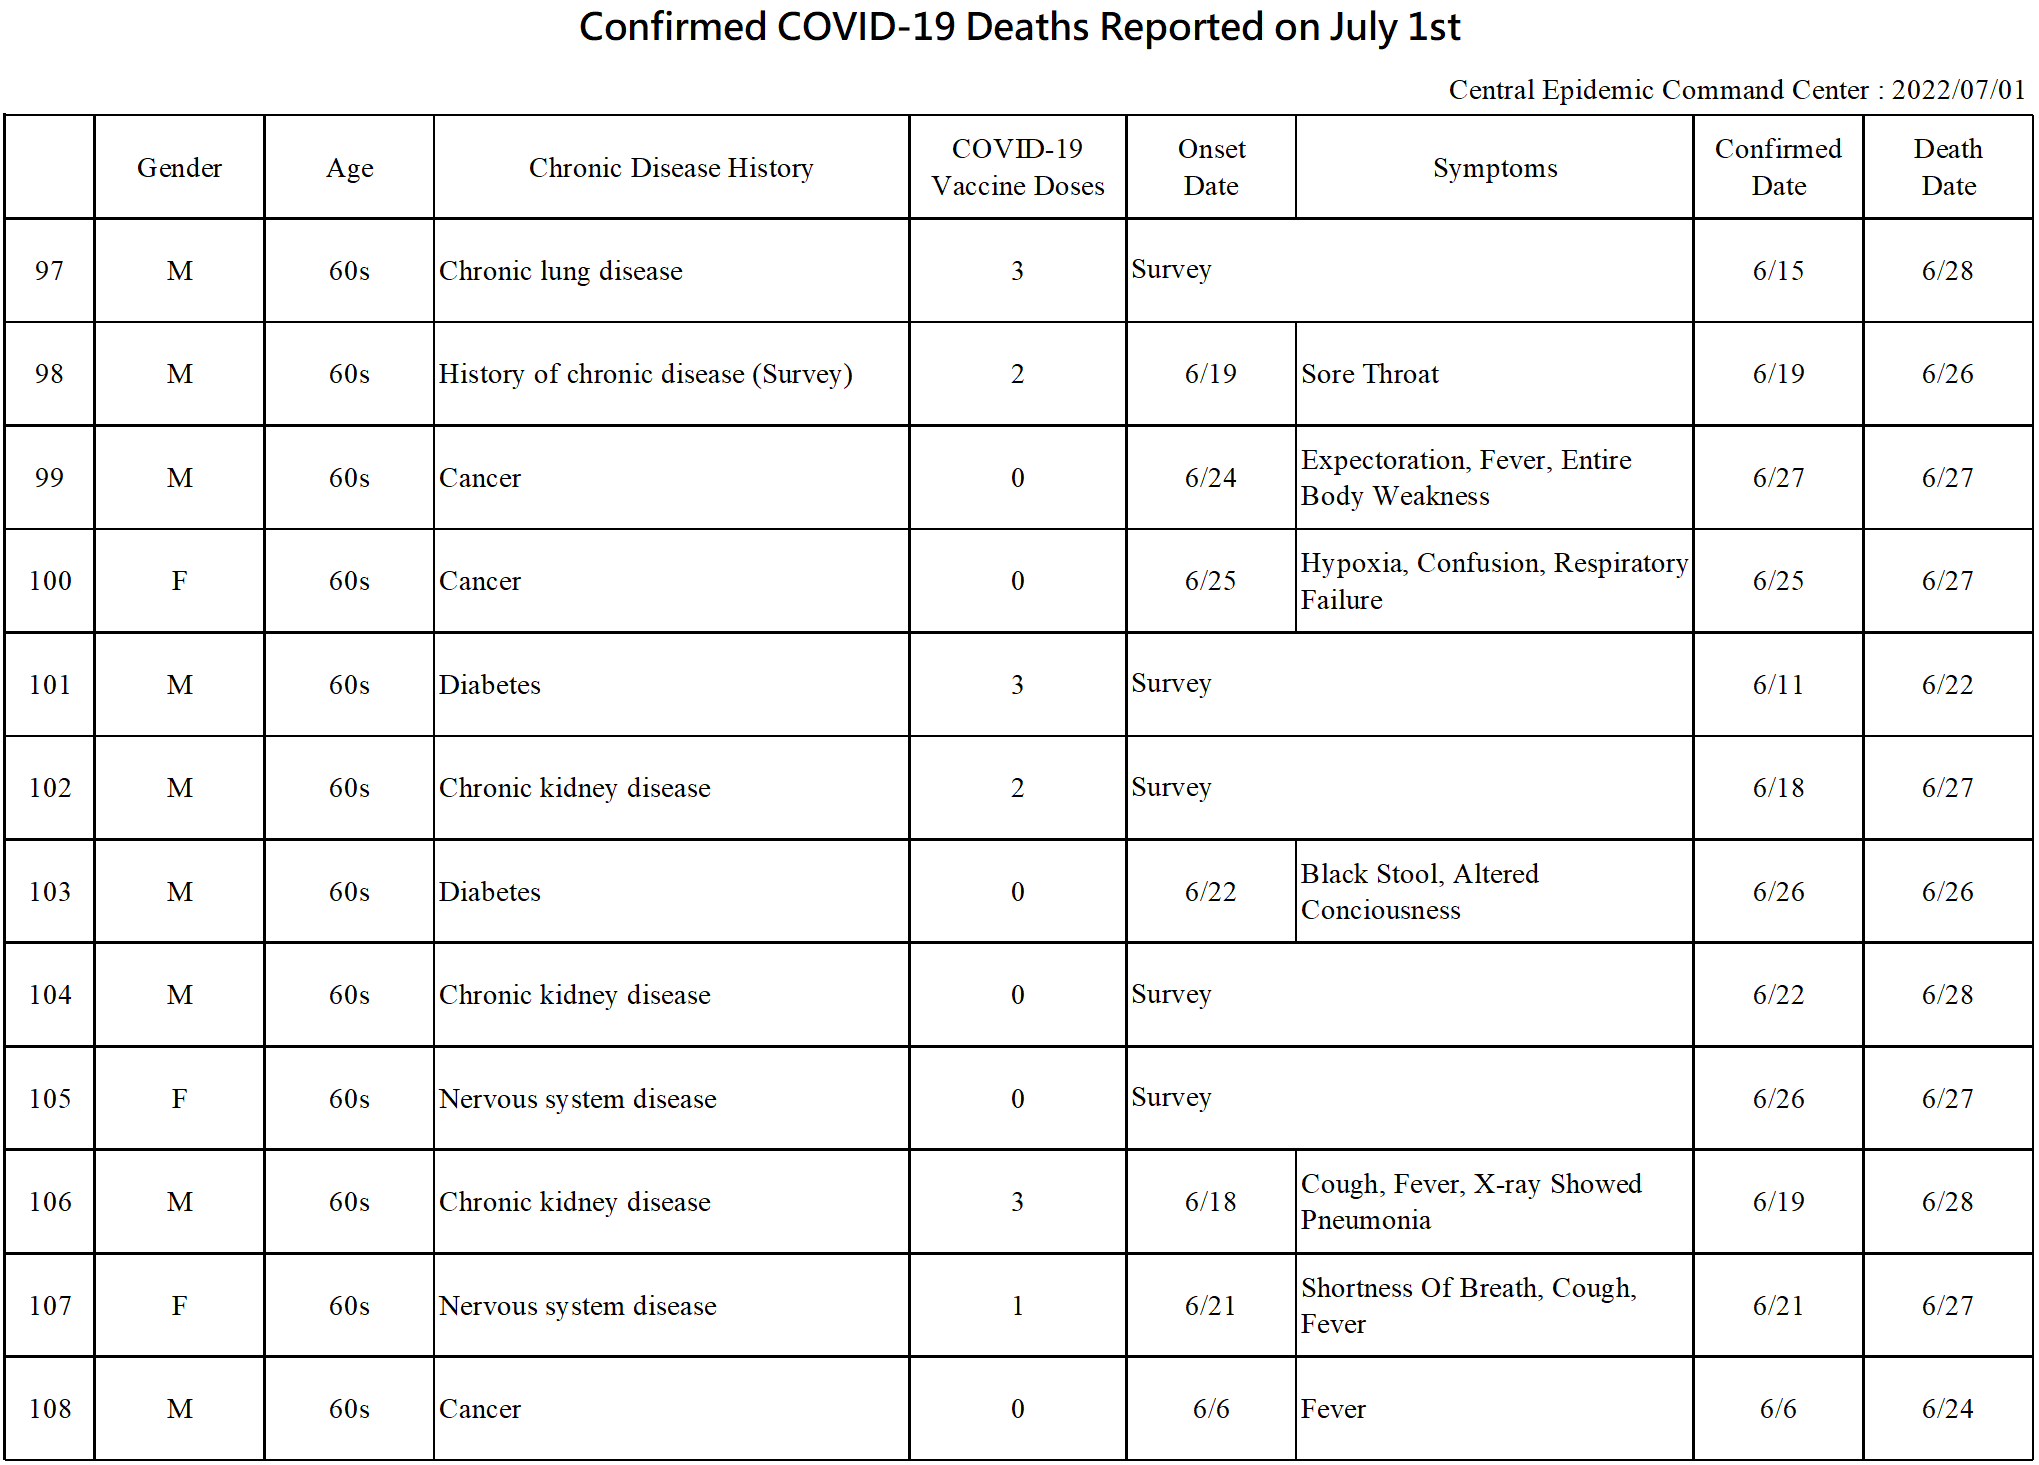
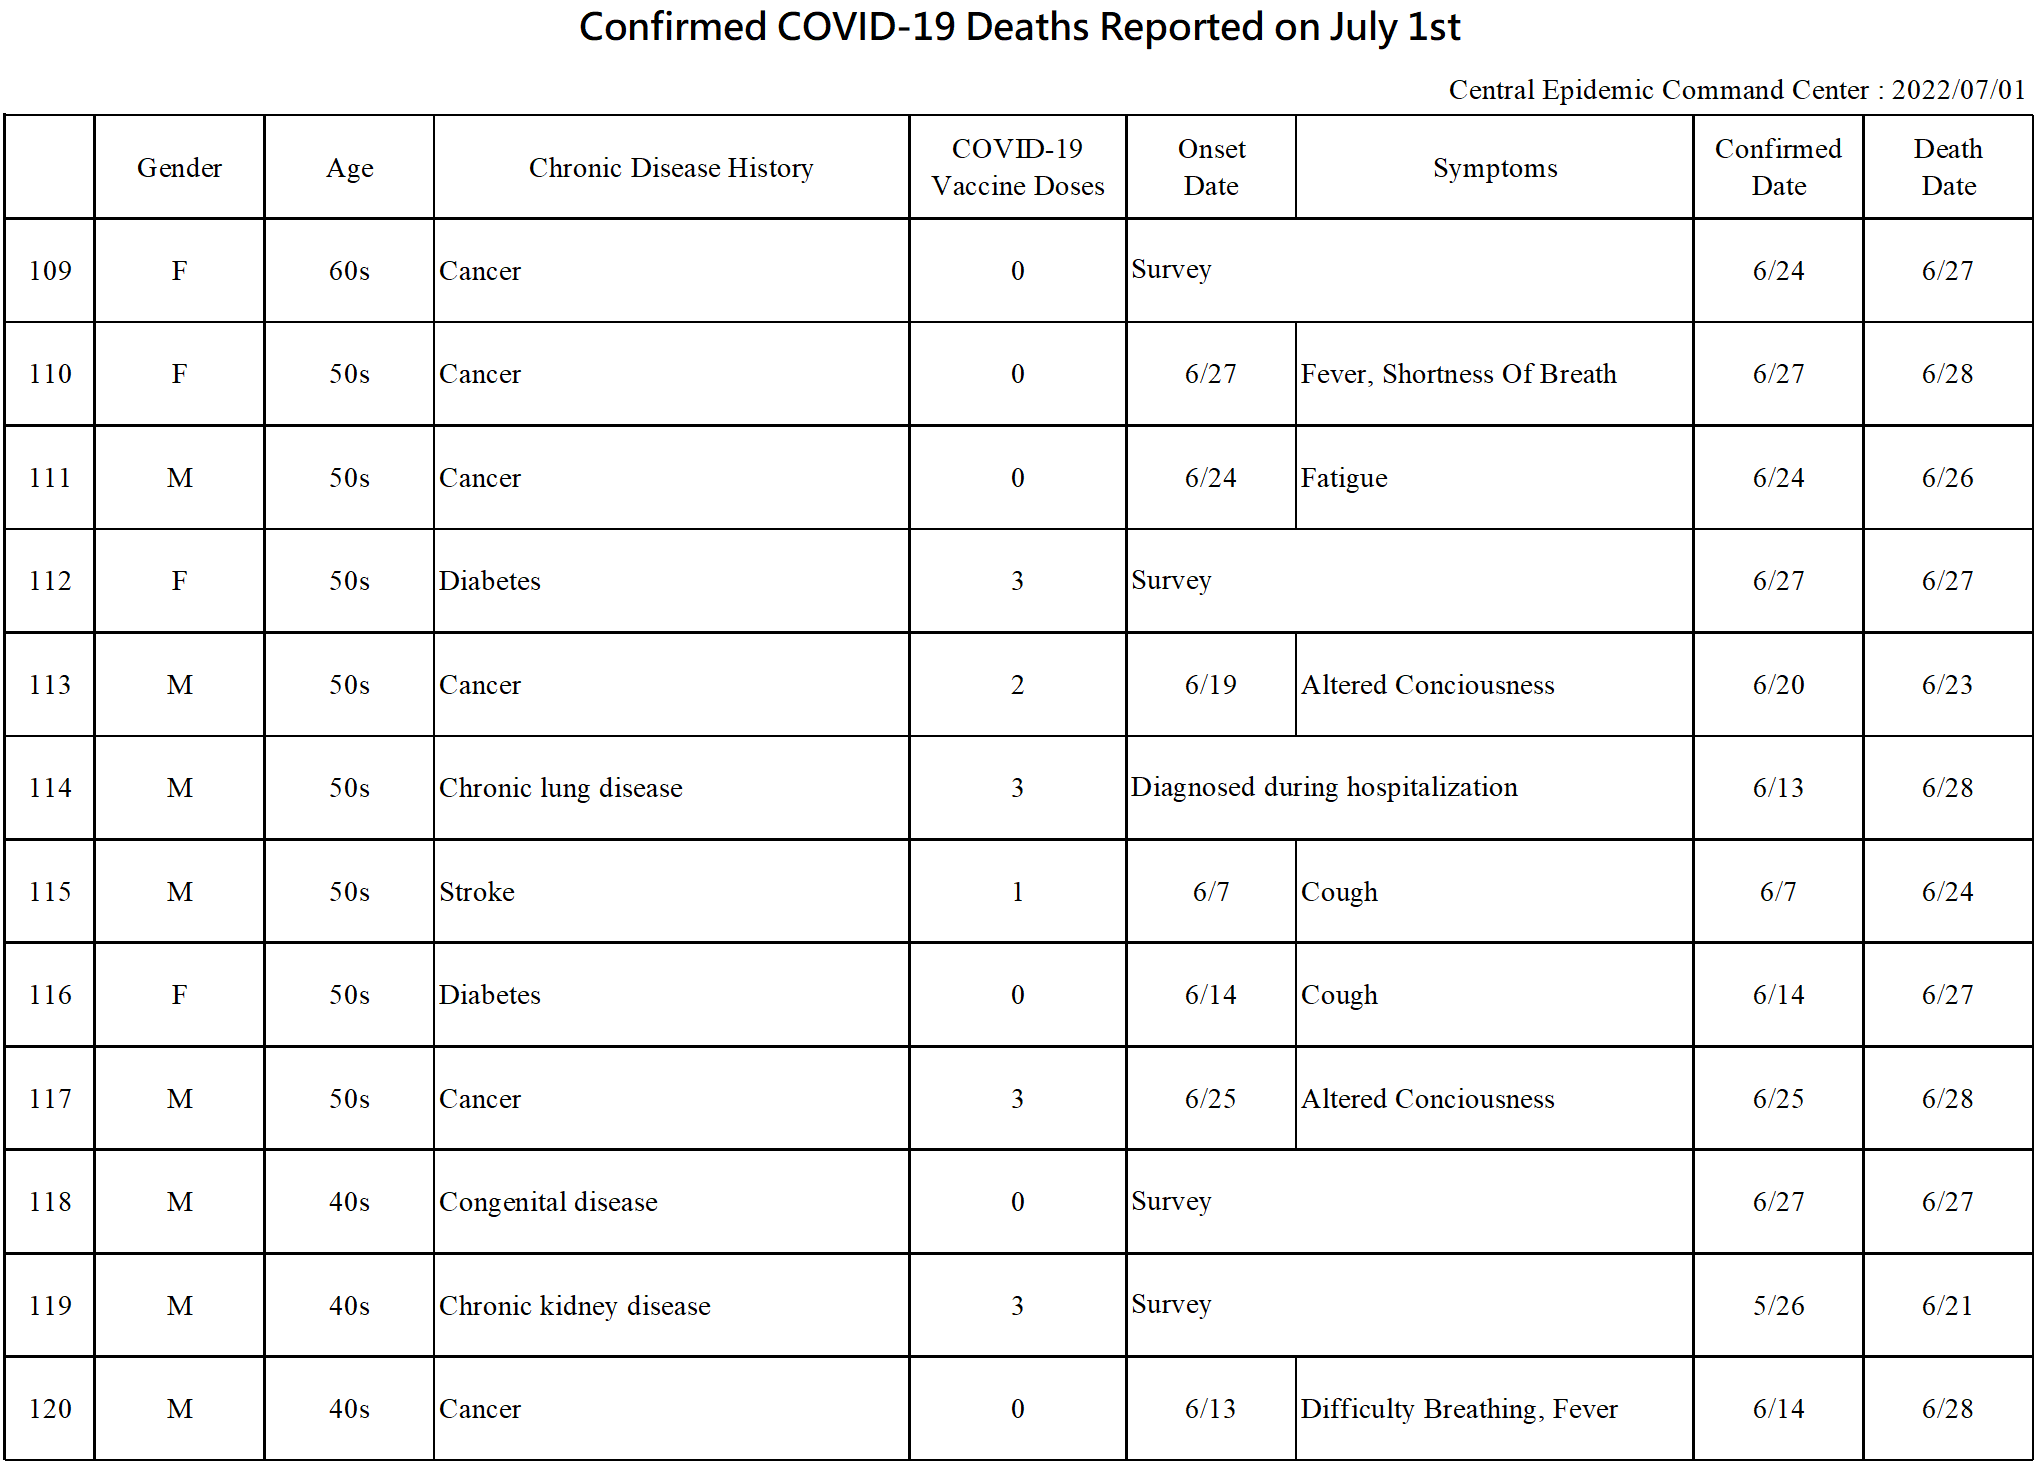
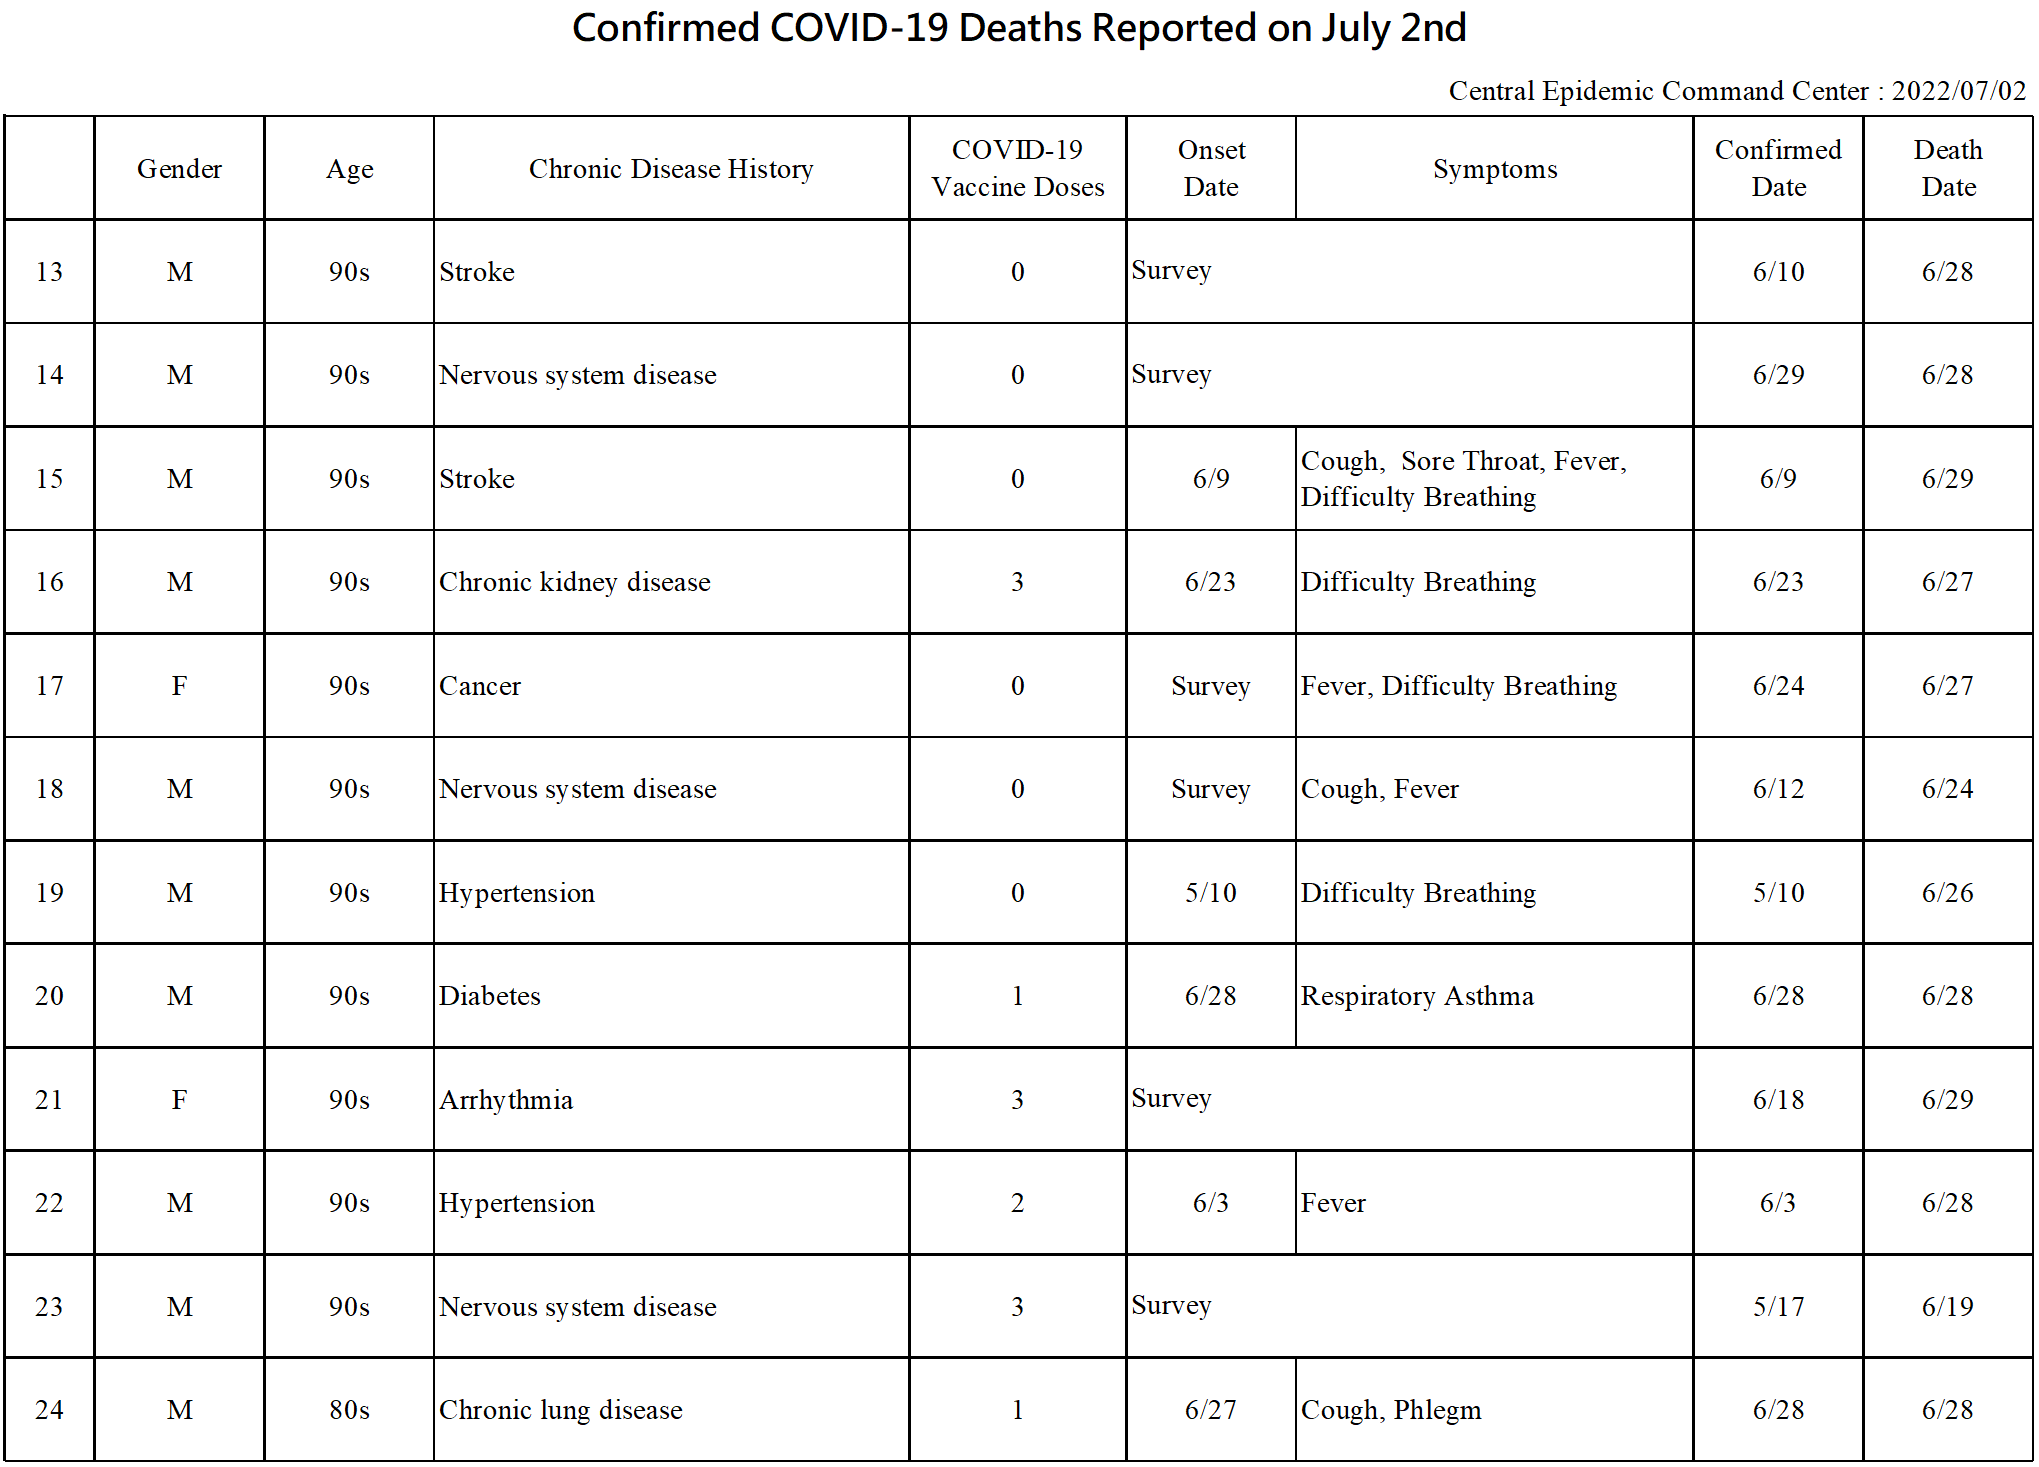
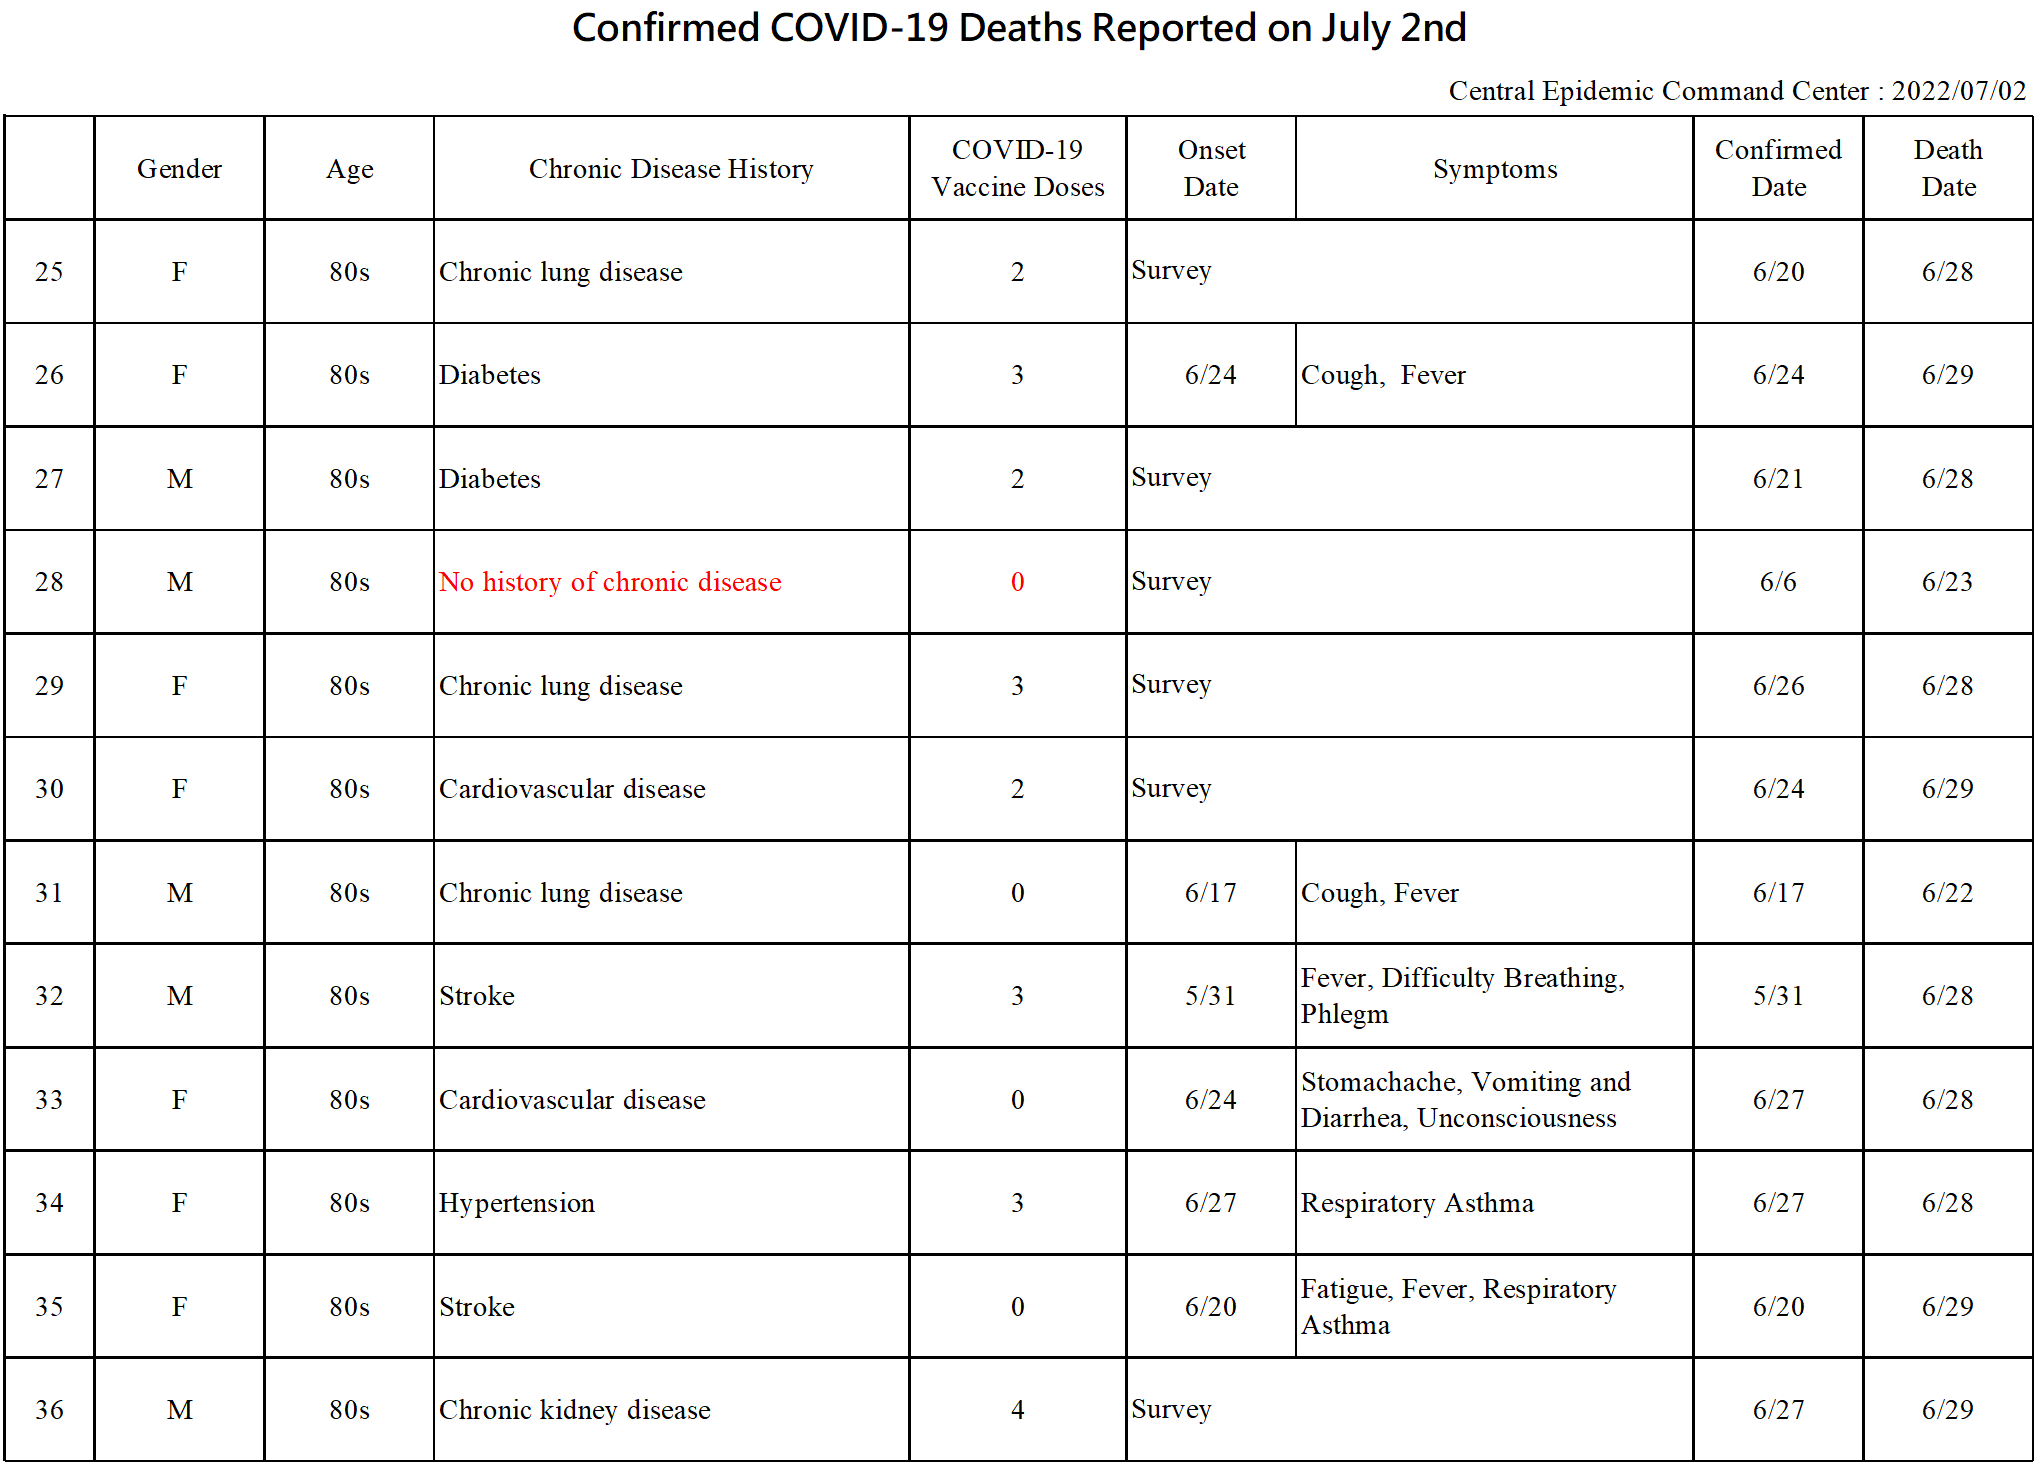
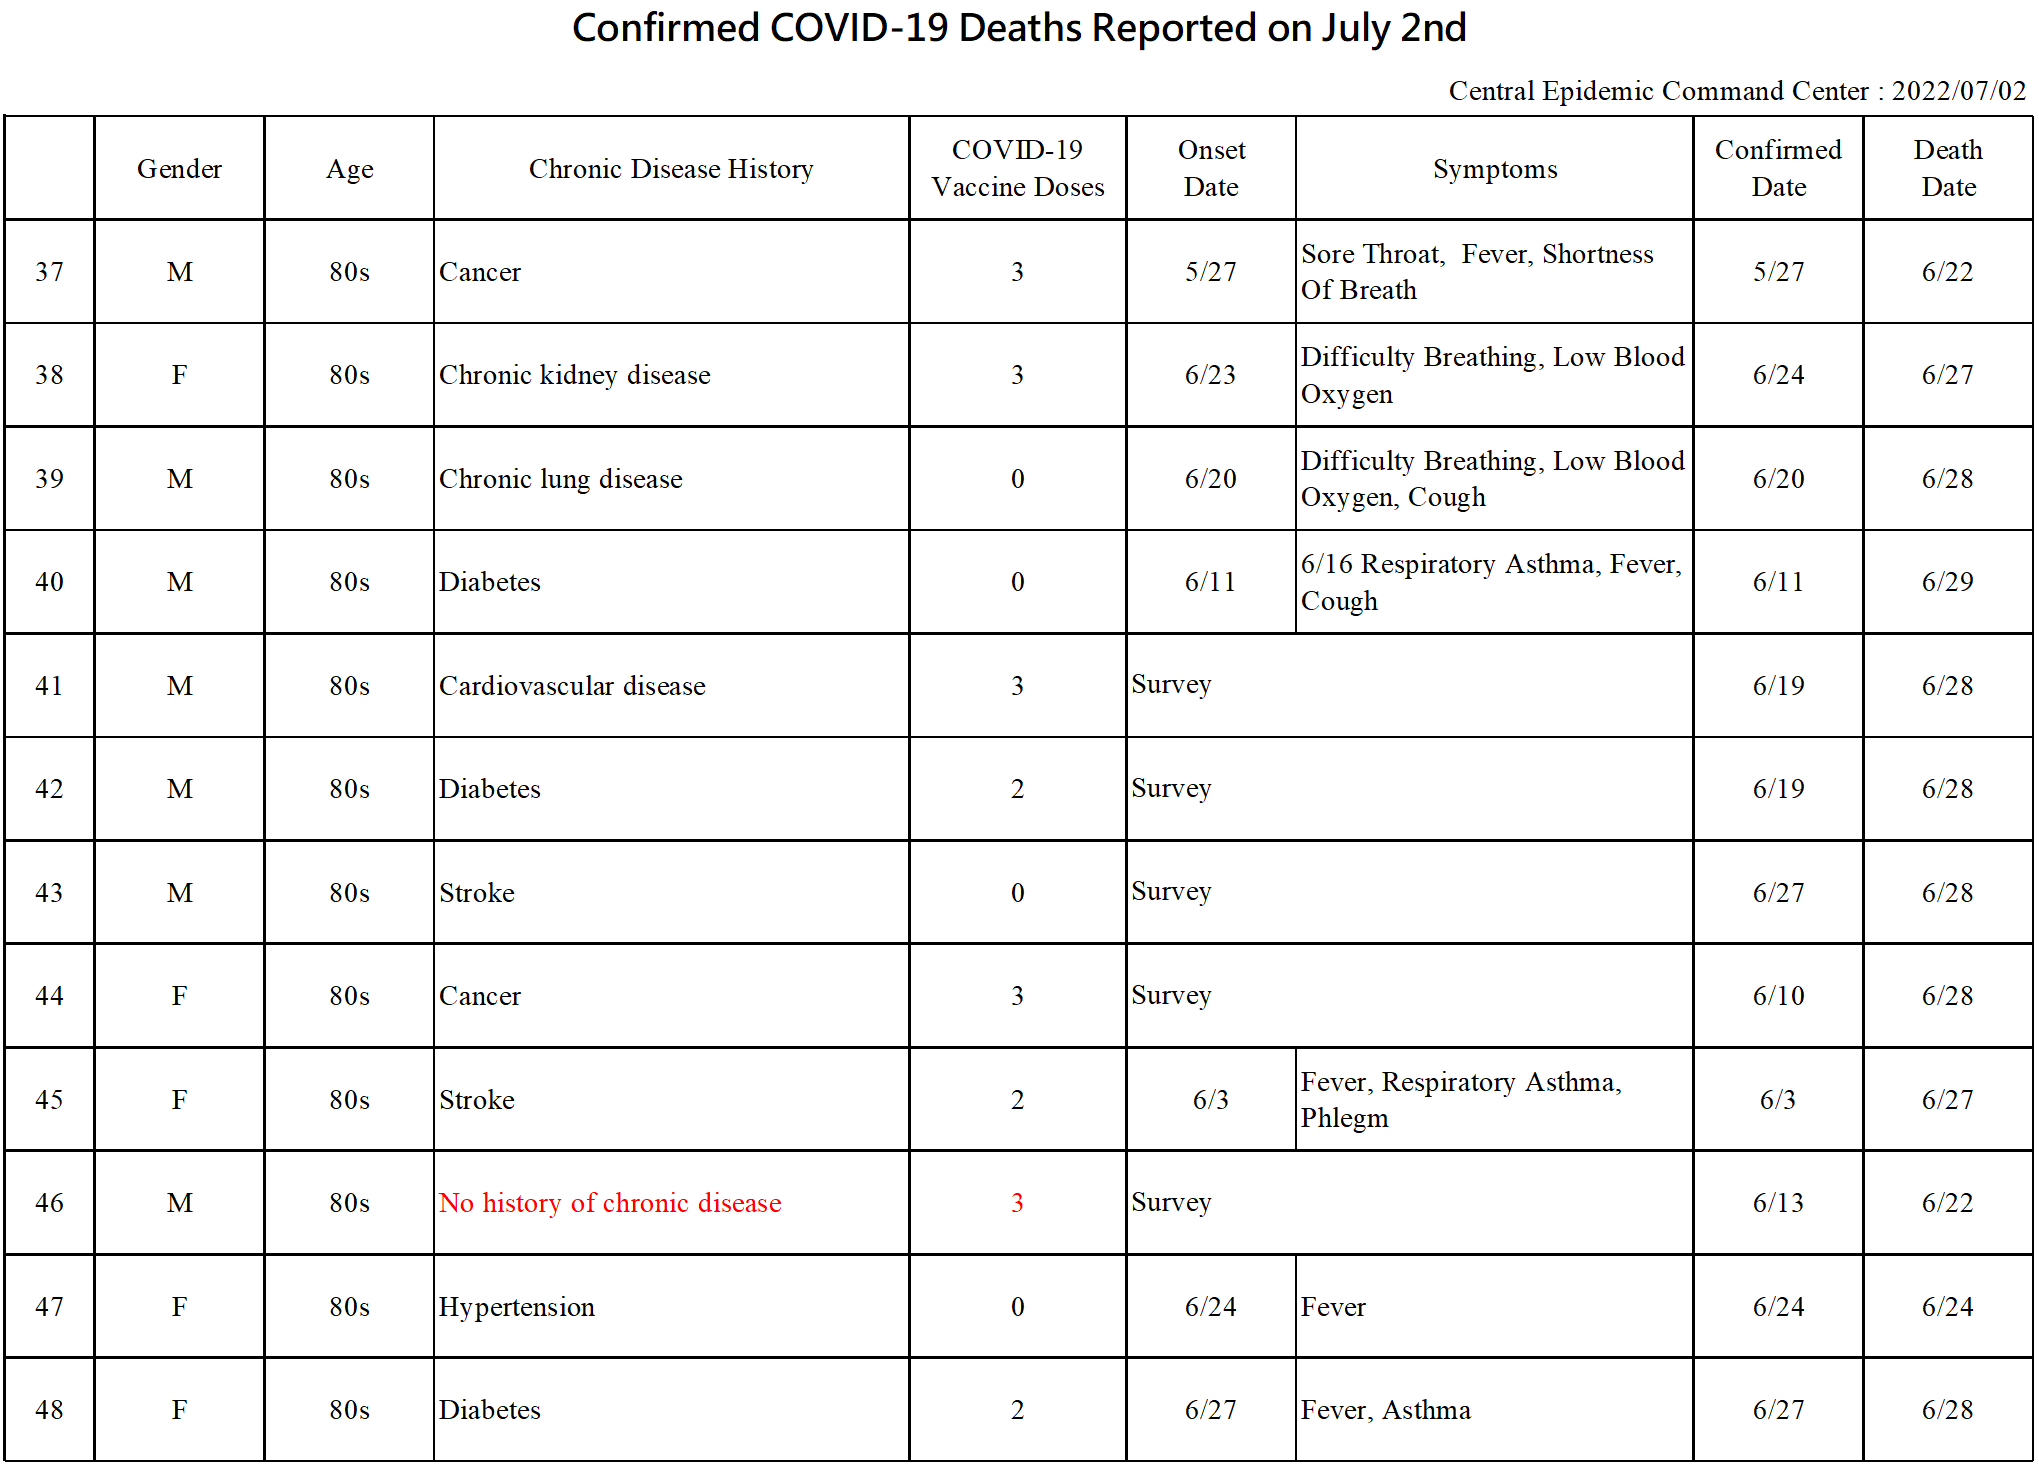
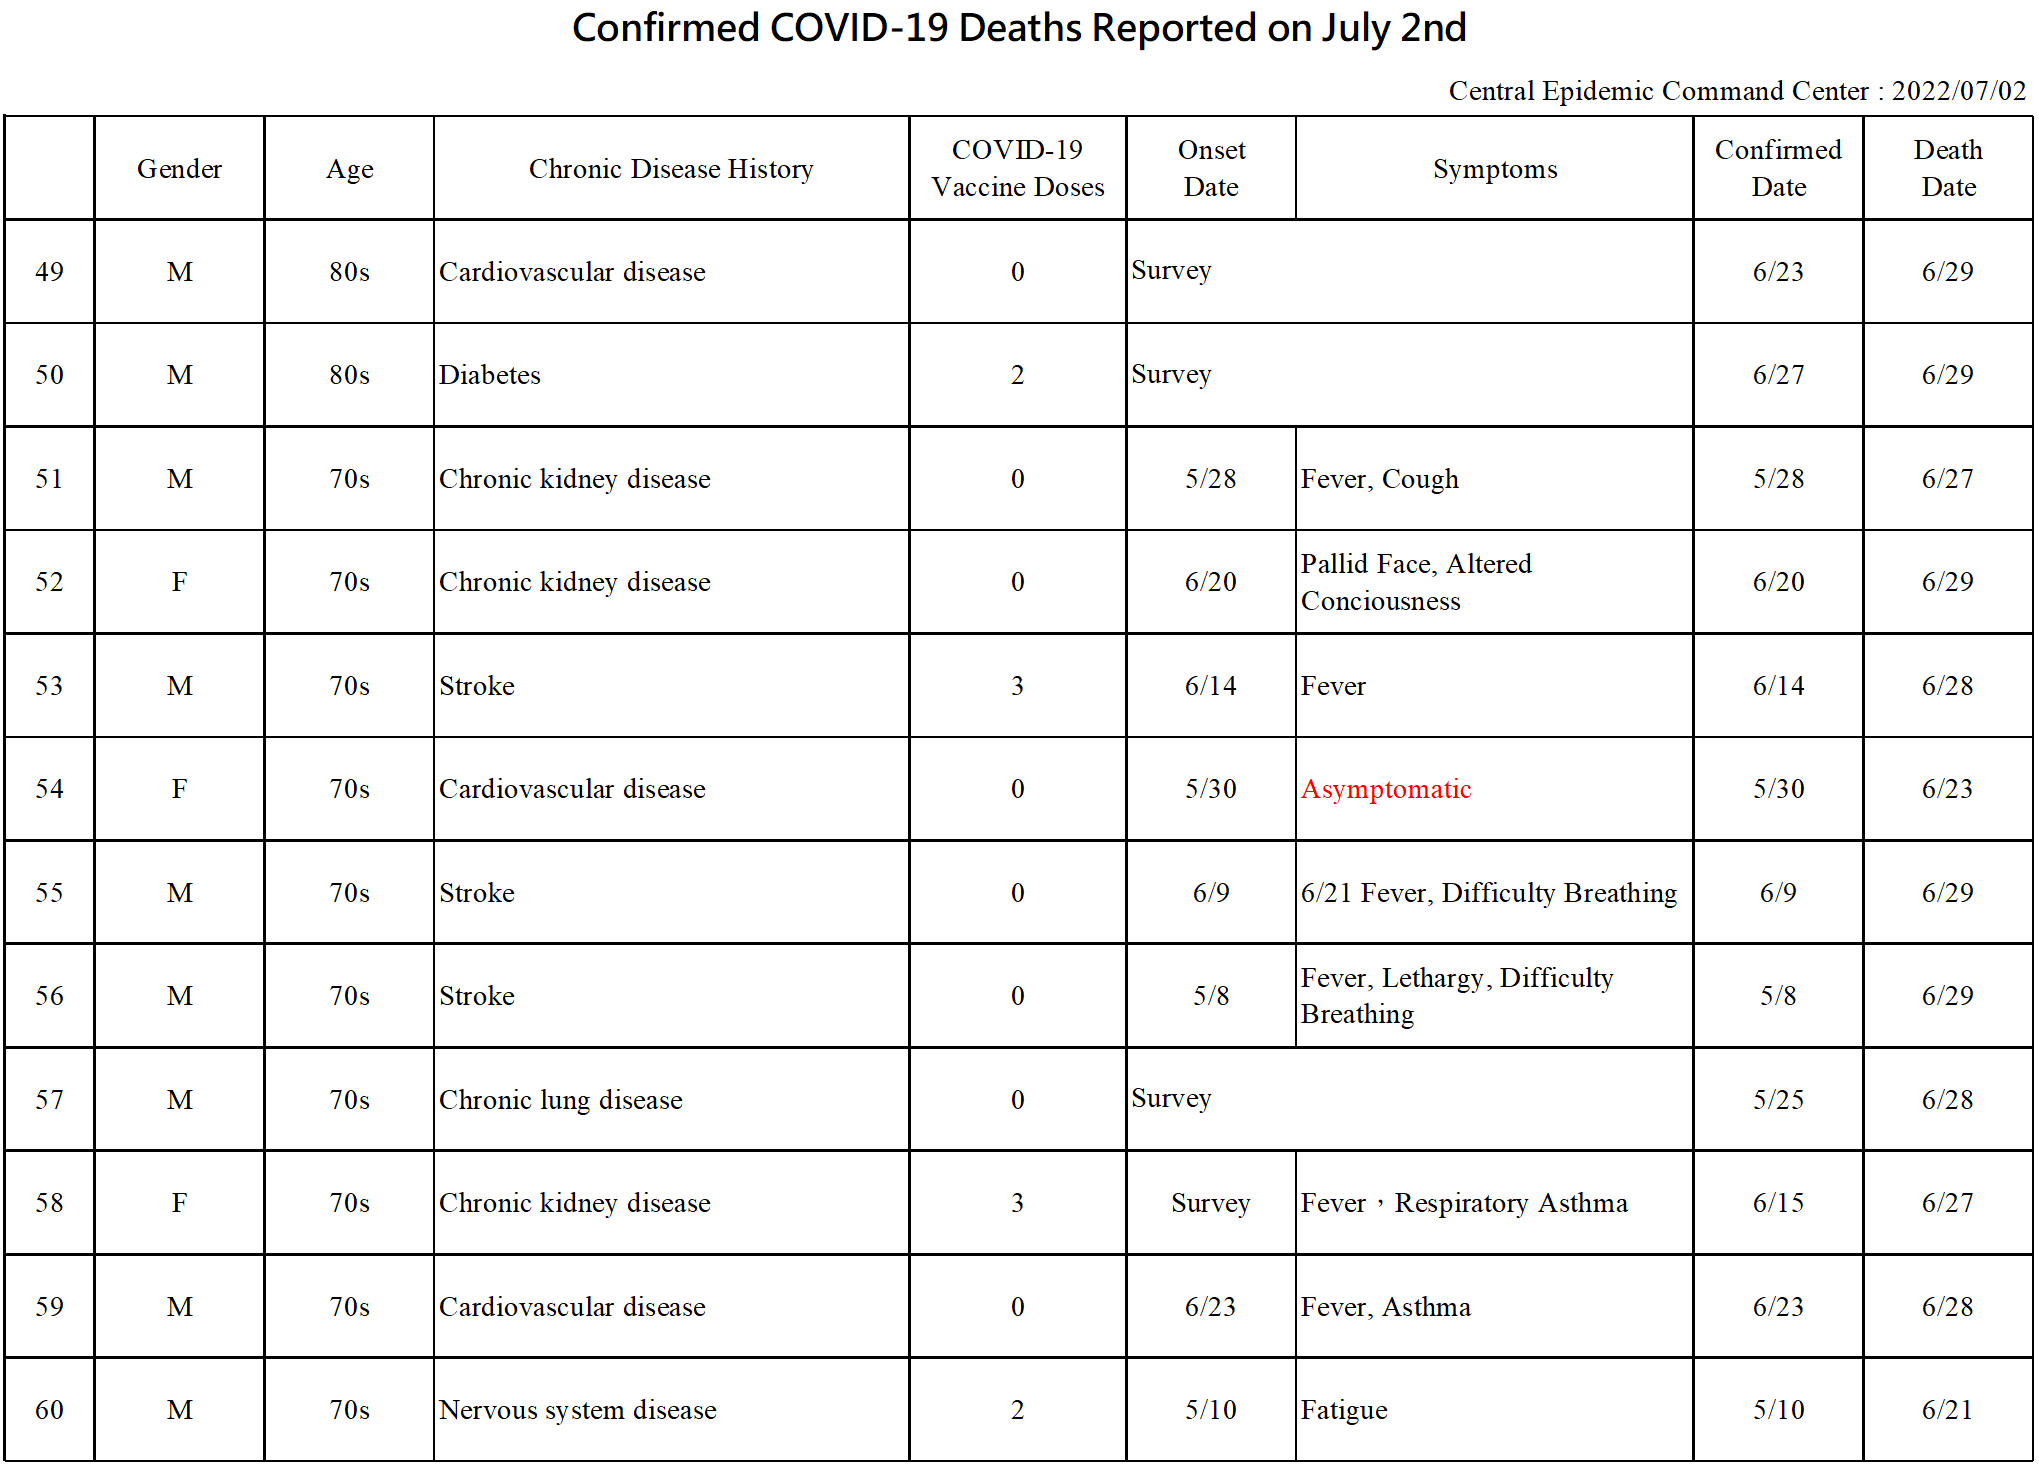
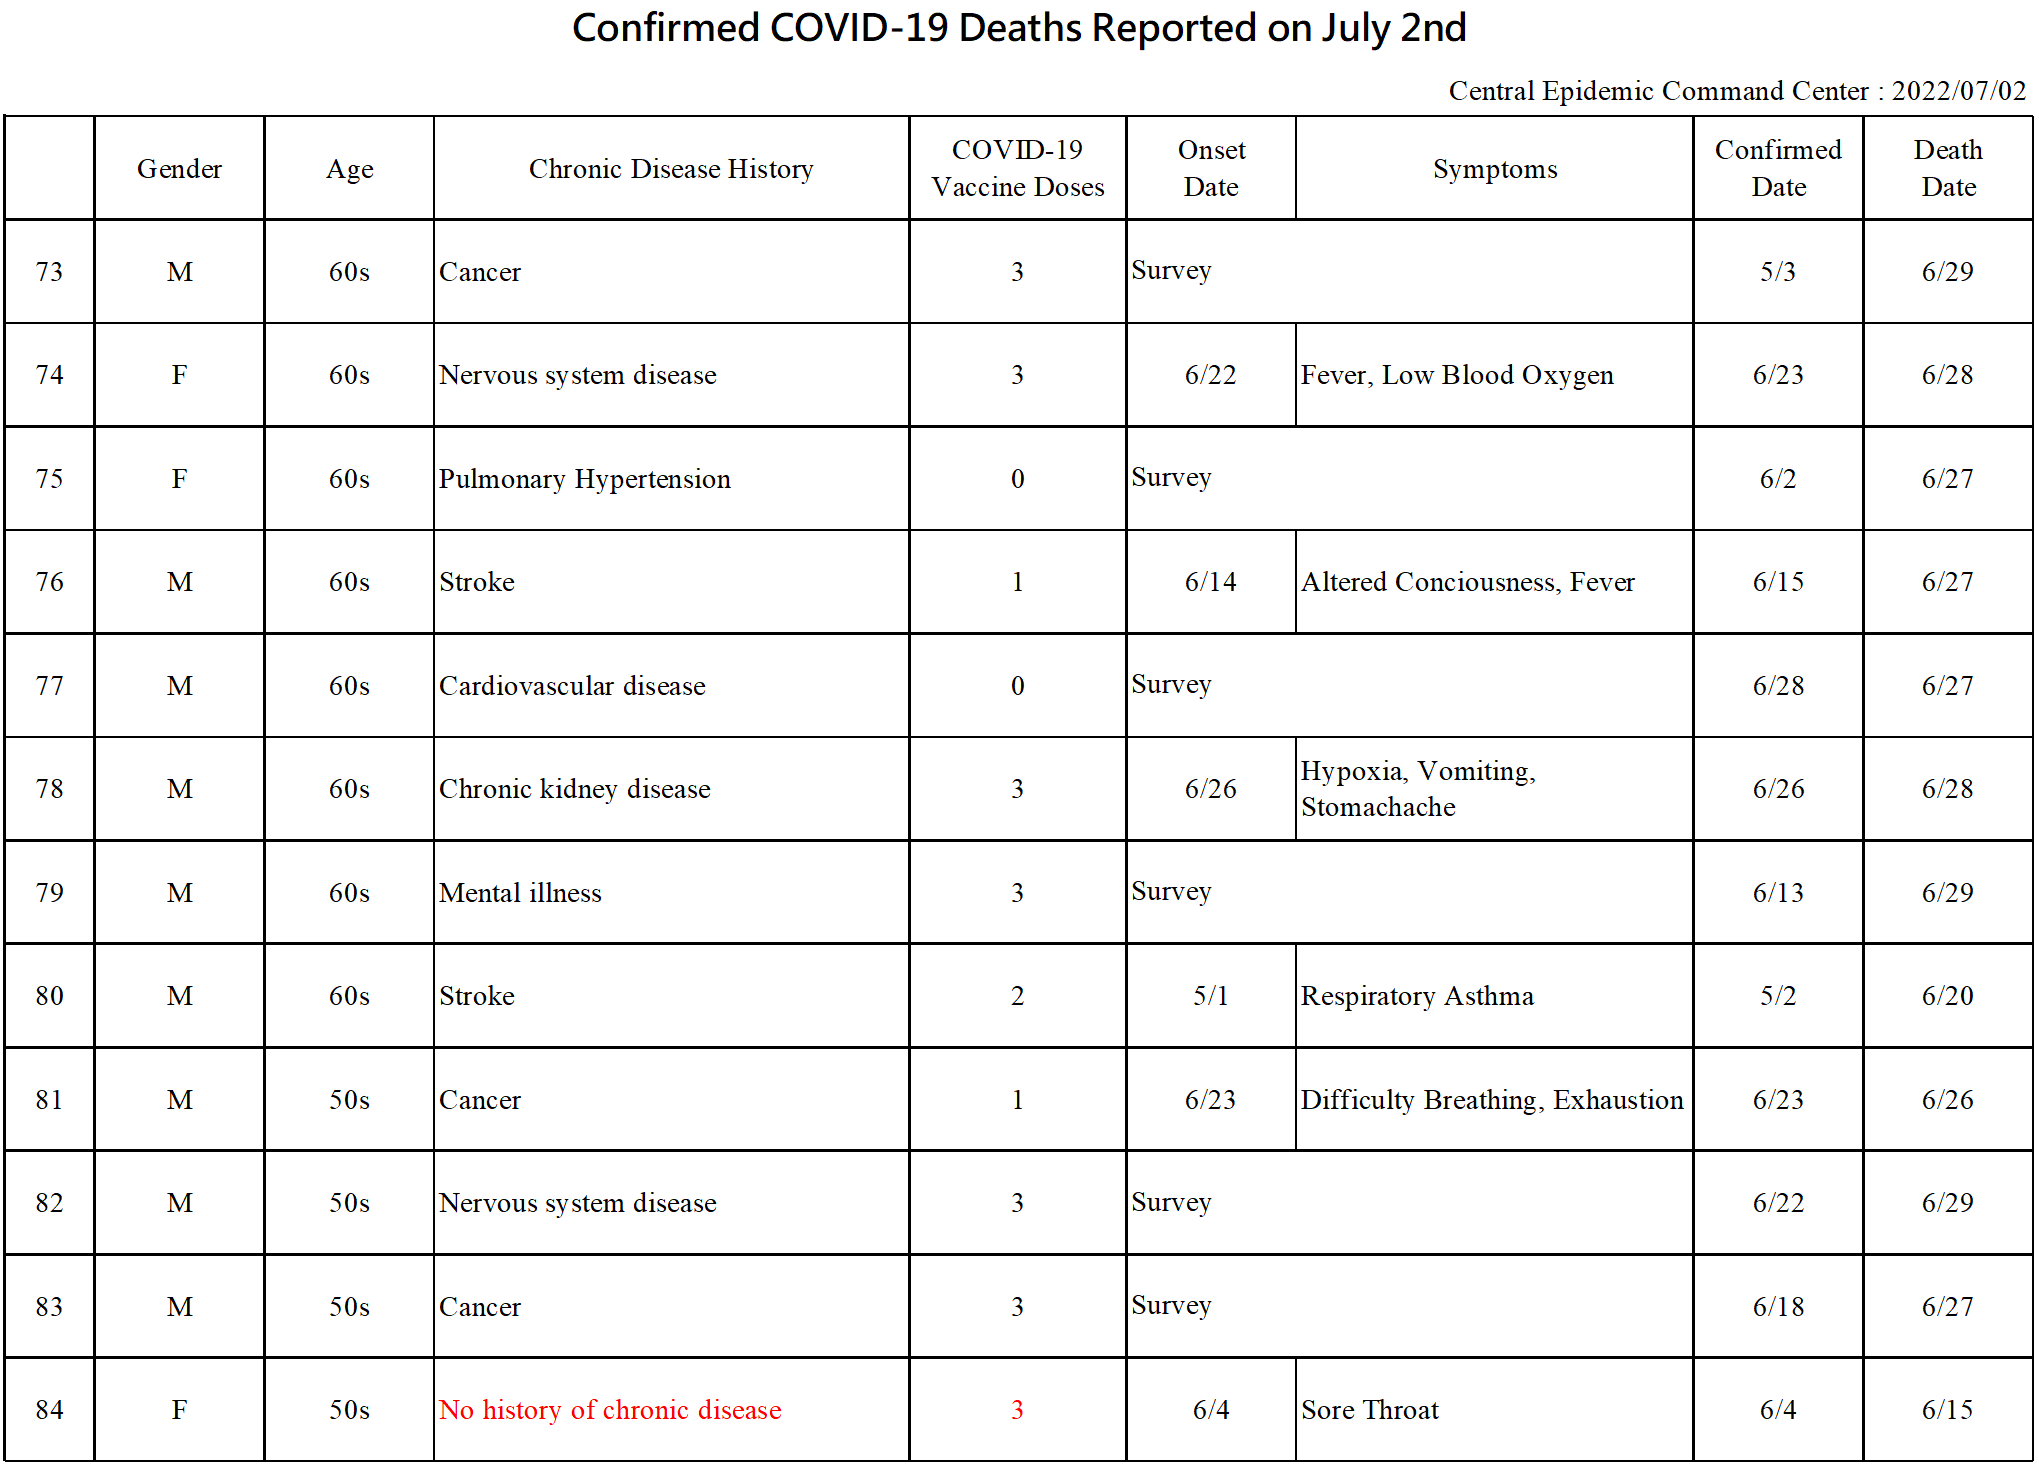
The command center pointed out that there were 96 new deaths from local cases today, including 61 males and 35 females, aged in their 40s to over 90s. All had severe infections, 90 had a history of chronic disease, and 61 had not received recommended 3 doses of COVID-19 vaccine and 41 had not had any doses at all. The date of diagnosis was between May 2 and June 29, 2022, and the date of death was between June 15 and June 29. Please refer to the attachment to the press release for details.
According to the command center, among the 79 new cases of immigration today, 48 were males and 31 were females; the ages ranged from under 5 years old to over 70 years old, from the United Kingdom (4 cases), the United States (2 cases), and Poland. , Spain, Vietnam, Thailand, Indonesia, South Korea, France, Belgium, the Philippines, Italy, the Netherlands, Malaysia and Germany (1 case each), and another 60 infected countries are under investigation. The entry date is from June 12 to July 1 this year.
According to the statistics of the command center, up to now, a total of 13,524,061 new coronavirus pneumonia-related notifications (including 9,681,626 excluded) have been reported in Taiwan, of which 3,837,856 were confirmed, including 14,799 imported cases, 3,823,003 local cases, 36 Dunmu Fleet cases, 3 aircraft infections, 1 case is unknown and 14 cases are under investigation. Since 2020, a total of 6,868 COVID-19 deaths have occurred, of which 6,853 are local. The counties and cities of the cases are distributed in New Taipei City with 1,708 cases, Taipei City with 896 cases, Taichung City with 632 cases, Kaohsiung City with 583 cases, Taoyuan City with 556 cases and Tainan City. 435 cases in Changhua County, 279 in Pingtung County, 177 in Yunlin County, 173 in Nantou County, 172 in Keelung City, 148 in Yilan County, 133 in Miaoli County, 122 in Chiayi County, 113 in Hualien County, There are 108 cases in Hsinchu County, 106 cases in Chiayi City, 89 cases in Taitung County, 64 cases in Hsinchu City, 9 cases each in Kinmen County and Penghu County; the other 15 cases were imported from abroad.
The command center once again calls on the public to complete vaccinations as soon as possible, implement personal protective measures such as hand hygiene, cough etiquette, and wearing masks, reduce unnecessary movement, activities or gatherings, and avoid entering and leaving crowded places or high risk of infection transmission and actively cooperate with various epidemic prevention measures, download and use the “Taiwan Social Distancing APP”, and jointly strictly guard the community defense line.